
Direct Answer
SEC EDGAR classifies BlackRock under SIC code 6211 (Security Brokers, Dealers & Flotation Companies). Among Swoopr's S&P 500 Equal Weight companies, 16 others share that classification; by latest reported revenue, BlackRock ranks 4 of 17. A filing classification is a starting point: a company's real competitors depend on its segments, which its 10-K describes.
How Does BlackRock Compare With Its Peers?
| Company | Revenue (latest FY) | Revenue growth | Operating margin | Net margin |
|---|---|---|---|---|
| Morgan Stanley (MS) | $70.6 billion FY2025 | 14.4% | n/a | 23.9% |
| Galaxy Digital Inc. (GLXY) | $60.4 billion FY2025 | 41.8% | n/a | -0.4% |
| Goldman Sachs (GS) | $58.3 billion FY2025 | 8.9% | n/a | 29.5% |
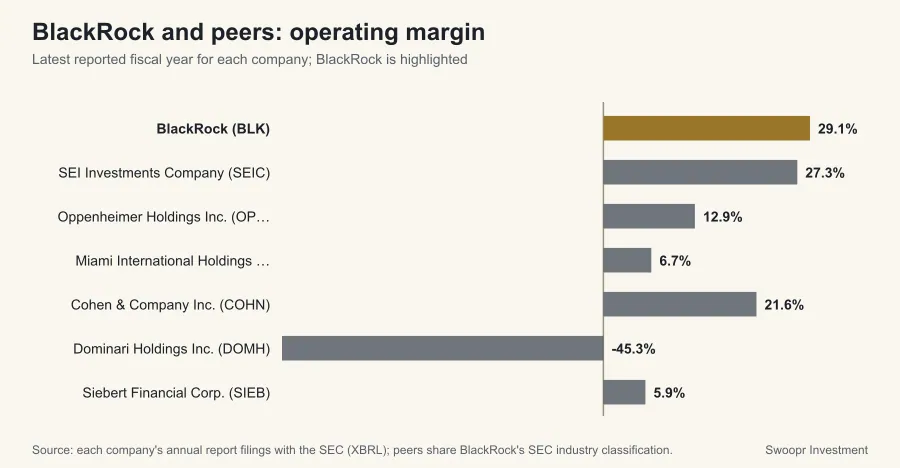
| BlackRock (BLK) | $24.2 billion FY2025 | 89.3% | 29.1% | 22.9% |
| Raymond James Financial (RJF) | $15.9 billion FY2025 | 6.6% | n/a | 13.4% |
| Jefferies Financial Group Inc. (JEF) | $10.8 billion FY2025 | 2.9% | n/a | 6.3% |
| Stifel Financial Corporation (SF) | $6.3 billion FY2025 | 6.7% | n/a | 10.2% |
| Robinhood Markets (HOOD) | $4.5 billion FY2025 | 51.6% | n/a | 42.1% |
| Interactive Brokers (IBKR) | $2.4 billion FY2025 | 23.4% | n/a | 178.6% |
| SEI Investments Company (SEIC) | $2.3 billion FY2025 | 8.1% | 27.3% | 31.1% |
| Piper Sandler Companies (PIPR) | $1.9 billion FY2025 | 24.3% | n/a | 14.8% |
| Oppenheimer Holdings Inc. (OPY) | $1.6 billion FY2025 | 14.4% | 12.9% | 9.1% |
| Miami International Holdings Inc. (MIAX) | $1.4 billion FY2025 | 19.6% | 6.7% | -5.1% |
| Webull Corporation (BULL) | $571 million FY2025 | 46.3% | n/a | 4.3% |
| Cohen & Company Inc. (COHN) | $276 million FY2025 | 246.2% | 21.6% | 5.2% |
| Dominari Holdings Inc. (DOMH) | $123 million FY2025 | 487.0% | -45.3% | -18.2% |
| Siebert Financial Corp. (SIEB) | $94 million FY2025 | 12.3% | 5.9% | 5.4% |
Revenue growth compares each company's latest fiscal year with the one before. Fiscal years do not always end on the same date, so treat close comparisons with care.
How Does BlackRock Rank Among All SEC Filers in Its Industry Code?
17 companies with annual reports in Swoopr's SEC dataset share SIC code 6211 (Security Brokers, Dealers & Flotation Companies), a wider group than the S&P 500 Equal Weight companies above. Ranks run from 1 (highest) and use each company's latest fiscal year, in U.S. dollars.
| Measure | BlackRock | Median of filers | Rank |
|---|---|---|---|
| Revenue | $24.2 billion | $2.4 billion | 4 of 17 |
| Revenue growth | 89.3% | 19.6% | 3 of 17 |
| Operating margin | 29.1% | 12.9% | 1 of 7 |
| Net margin | 22.9% | 10.2% | 6 of 17 |
A SIC code reflects the filer's main business as the SEC records it, so the group mixes companies of very different size; the median is a better guide than the average, and a rank near the top by revenue says nothing about quality.
Where These Numbers Come From
Every figure on this page is a value BlackRock reported in its own SEC filings, read from the SEC's XBRL data (accession 0001193125-26-071966 for fiscal year 2025). Ratios are computed from those reported values. Figures were retrieved on October 7, 2026; a later amendment or a new annual report can change them, and the filing itself always takes precedence over this summary.
Each fiscal year is labeled by the calendar year in which it ended, so a company that names the same period differently in its own filings (many retailers whose year ends in January) may use another label. A year is left out of the table when the SEC data set holds no value for it. A figure shown as "Not reported" means the company did not file a value under the standard tag Swoopr reads, not that the amount was zero. This page is educational and describes reported history only; it is not a forecast or a recommendation.
Frequently Asked Questions
Who are BlackRock's competitors?
Companies sharing BlackRock's SEC classification (SIC code 6211 (Security Brokers, Dealers & Flotation Companies)) include Morgan Stanley (MS), Galaxy Digital Inc. (GLXY), Goldman Sachs (GS), Raymond James Financial (RJF), Jefferies Financial Group Inc. (JEF). Its 10-K names the competitors it considers most relevant.
How does BlackRock compare with its peers on margins?
BlackRock's fiscal 2025 operating margin was 29.1%, against a peer median of 9.8%.
How are these peers chosen?
By the SEC Standard Industrial Classification code each company files under, within Swoopr's S&P 500 Equal Weight company set, falling back to the two-digit major group when fewer than two companies share the exact code. Classification codes are broad, so read the peer list as a screen, not a verdict.
How does BlackRock rank among all companies in its SEC industry?
Among 17 SEC filers under SIC code 6211, BlackRock ranks 4 by latest revenue, and 1 of 7 by operating margin (29.1% against a median of 12.9%).