
Direct Answer
SEC EDGAR classifies Allegion under SIC major group 73. Among Swoopr's S&P 500 Equal Weight companies, 354 others share that classification; by latest reported revenue, Allegion ranks 67 of 355. A filing classification is a starting point: a company's real competitors depend on its segments, which its 10-K describes.
How Does Allegion Compare With Its Peers?
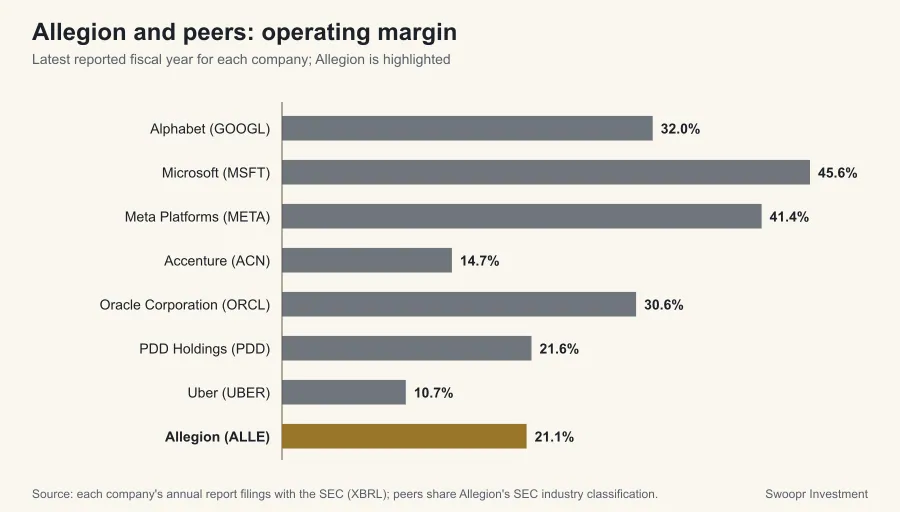
| Company | Revenue (latest FY) | Revenue growth | Operating margin | Net margin |
|---|---|---|---|---|
| Alphabet (GOOGL) | $403 billion FY2025 | 15.1% | 32.0% | 32.8% |
| Microsoft (MSFT) | $282 billion FY2025 | 14.9% | 45.6% | 36.1% |
| Meta Platforms (META) | $201 billion FY2025 | 22.2% | 41.4% | 30.1% |
| Accenture (ACN) | $69.7 billion FY2025 | 7.4% | 14.7% | 11.0% |
| Oracle Corporation (ORCL) | $67.4 billion FY2026 | 17.3% | 30.6% | 25.2% |
| PDD Holdings (PDD) | $61.8 billion FY2025 | 14.5% | 21.6% | 22.7% |
| Uber (UBER) | $52.0 billion FY2025 | 18.3% | 10.7% | 19.3% |
| Salesforce (CRM) | $41.5 billion FY2026 | 9.6% | 20.1% | 18.0% |
| Visa Inc. (V) | $40.0 billion FY2025 | 11.3% | 60.0% | 50.1% |
| PayPal (PYPL) | $33.2 billion FY2025 | 4.3% | 18.3% | 15.8% |
| Mastercard (MA) | $32.8 billion FY2025 | 16.4% | 57.6% | 45.6% |
| MercadoLibre (MELI) | $28.9 billion FY2025 | 39.1% | 11.1% | 6.9% |
| Block, Inc. (XYZ) | $24.2 billion FY2025 | 0.3% | 7.1% | 5.4% |
| Adobe (ADBE) | $23.8 billion FY2025 | 10.5% | 36.6% | 30.0% |
| Fiserv (FISV) | $21.2 billion FY2025 | 3.6% | 27.5% | 16.4% |
| Cognizant (CTSH) | $21.1 billion FY2025 | 7.0% | 16.1% | 10.6% |
| Automatic Data Processing (ADP) | $20.6 billion FY2025 | 7.1% | n/a | 19.8% |
| Intuit (INTU) | $18.8 billion FY2025 | 15.6% | 26.1% | 20.5% |
| ManpowerGroup (MAN) | $18.0 billion FY2025 | 0.6% | 0.8% | -0.1% |
| Omnicom Group (OMC) | $17.3 billion FY2025 | 10.1% | 2.6% | -0.3% |
| Leidos (LDOS) | $17.2 billion FY2025 | 3.1% | 12.3% | 8.4% |
| United Rentals (URI) | $16.1 billion FY2025 | 4.9% | 24.7% | 15.5% |
| S&P Global (SPGI) | $15.3 billion FY2025 | 7.9% | 42.2% | 29.2% |
| Kyndryl Holdings Inc. (KD) | $15.1 billion FY2026 | 0.2% | n/a | 1.2% |
| DoorDash (DASH) | $13.7 billion FY2025 | 27.9% | 5.3% | 6.8% |
| ServiceNow (NOW) | $13.3 billion FY2025 | 20.9% | 13.7% | 13.2% |
| Airbnb (ABNB) | $12.2 billion FY2025 | 10.3% | 20.8% | 20.5% |
| Shopify (SHOP) | $11.6 billion FY2025 | 30.1% | 12.7% | 10.7% |
| eBay Inc. (EBAY) | $11.1 billion FY2025 | 7.9% | 20.5% | 18.3% |
| Fidelity National Information Services (FIS) | $10.7 billion FY2025 | 5.4% | 16.3% | 3.6% |
| Workday (WDAY) | $9.6 billion FY2026 | 13.1% | 7.5% | 7.3% |
| CACI International Inc. (CACI) | $8.6 billion FY2025 | 12.6% | 8.9% | 5.8% |
| APi Group Corporation (APG) | $7.9 billion FY2025 | 12.7% | 7.0% | 3.8% |
| Global Payments (GPN) | $7.7 billion FY2025 | -0.4% | 22.8% | 18.2% |
| Science Applications International Corporation (SAIC) | $7.3 billion FY2026 | -2.9% | 7.2% | 4.9% |
| Autodesk (ADSK) | $7.2 billion FY2026 | 17.5% | 21.9% | 15.6% |
| Synopsys (SNPS) | $7.1 billion FY2025 | 15.1% | 13.0% | 18.9% |
| Broadridge Financial Solutions (BR) | $6.9 billion FY2025 | 5.9% | 17.3% | 12.2% |
| Take-Two Interactive (TTWO) | $6.7 billion FY2026 | 18.2% | -1.6% | -4.5% |
| Parsons Corporation (PSN) | $6.4 billion FY2025 | -5.7% | 6.6% | 3.8% |
| SS&C Technologies Holdings Inc. (SSNC) | $6.3 billion FY2025 | 6.6% | 22.9% | 12.7% |
| Toast Inc. (TOST) | $6.2 billion FY2025 | 24.1% | 4.7% | 5.6% |
| Equifax (EFX) | $6.1 billion FY2025 | 6.9% | 18.0% | 10.9% |
| Snap Inc. (SNAP) | $5.9 billion FY2025 | 10.6% | -9.0% | -7.8% |
| AppLovin (APP) | $5.5 billion FY2025 | 70.0% | 75.8% | 60.8% |
| Maximus Inc. (MMS) | $5.4 billion FY2025 | 2.4% | 9.7% | 5.9% |
| Cadence Design Systems (CDNS) | $5.3 billion FY2025 | 14.1% | 28.2% | 20.9% |
| CoreWeave (CRWV) | $5.1 billion FY2025 | 167.9% | -0.9% | -22.8% |
| Twilio Inc. (TWLO) | $5.1 billion FY2025 | 13.7% | 3.1% | 0.7% |
| TriNet Group Inc. (TNET) | $5.0 billion FY2025 | -0.9% | n/a | 3.1% |
| Gen Digital (GEN) | $5.0 billion FY2026 | 27.1% | 42.4% | 19.5% |
| GoDaddy (GDDY) | $5.0 billion FY2025 | 8.3% | 22.8% | 17.7% |
| Roblox Corporation (RBLX) | $4.9 billion FY2025 | 35.8% | -25.2% | -21.9% |
| Zoom Communications Inc. (ZM) | $4.9 billion FY2026 | 4.4% | 23.1% | 39.0% |
| CrowdStrike (CRWD) | $4.8 billion FY2026 | 21.7% | -6.1% | -3.3% |
| Snowflake Inc. (SNOW) | $4.7 billion FY2026 | 29.2% | -30.6% | -28.4% |
| TransUnion (TRU) | $4.6 billion FY2025 | 9.4% | 18.7% | 10.0% |
| Corpay (CPAY) | $4.5 billion FY2025 | 13.9% | 44.0% | 23.6% |
| Palantir Technologies (PLTR) | $4.5 billion FY2025 | 56.2% | 31.6% | 36.3% |
| EquipmentShare.com Inc (EQPT) | $4.4 billion FY2025 | 16.3% | 6.8% | 0.9% |
| Herc Holdings Inc. (HRI) | $4.4 billion FY2025 | 22.6% | n/a | 0.0% |
| Kelly Services Inc. (KELYB) | $4.3 billion FY2025 | -1.9% | -1.6% | -0.0% |
| Pinterest Inc. (PINS) | $4.2 billion FY2025 | 15.8% | 7.6% | 9.9% |
| Akamai Technologies (AKAM) | $4.2 billion FY2025 | 5.4% | 13.5% | 10.7% |
| NIQ Global Intelligence plc (NIQ) | $4.2 billion FY2025 | 5.7% | 2.0% | -8.4% |
| Shift4 Payments Inc. (FOUR) | $4.2 billion FY2025 | 25.5% | 8.4% | 3.5% |
| Allegion (ALLE) | $4.1 billion FY2025 | 7.8% | 21.1% | 15.8% |
| Rollins, Inc. (ROL) | $3.8 billion FY2025 | 11.0% | 19.3% | 14.0% |
| Maplebear Inc. (CART) | $3.7 billion FY2025 | 10.8% | 13.3% | 11.9% |
| Advantage Solutions Inc. (ADV) | $3.5 billion FY2025 | -0.7% | -3.6% | -6.4% |
| Datadog (DDOG) | $3.4 billion FY2025 | 27.7% | -1.3% | 3.1% |
| CoStar Group (CSGP) | $3.2 billion FY2025 | 18.7% | -2.2% | 0.2% |
| DocuSign Inc. (DOCU) | $3.2 billion FY2026 | 8.2% | 9.3% | 9.6% |
| Veeva Systems (VEEV) | $3.2 billion FY2026 | 16.3% | 28.7% | 28.4% |
| MSCI (MSCI) | $3.1 billion FY2025 | 9.7% | 54.7% | 38.4% |
| HubSpot Inc. (HUBS) | $3.1 billion FY2025 | 19.2% | 0.2% | 1.5% |
| Verisk Analytics (VRSK) | $3.1 billion FY2025 | 6.6% | 43.7% | 29.6% |
| Conduent Incorporated (CNDT) | $3.0 billion FY2025 | -9.4% | n/a | -5.6% |
| Korn Ferry (KFY) | $2.9 billion FY2026 | 6.4% | 12.8% | 9.6% |
| Okta Inc. (OKTA) | $2.9 billion FY2026 | 11.8% | 5.1% | 8.1% |
| The Trade Desk (TTD) | $2.9 billion FY2025 | 18.5% | 20.3% | 15.3% |
| CBIZ Inc. (CBZ) | $2.8 billion FY2025 | 52.1% | 8.5% | 4.2% |
| PTC Inc. (PTC) | $2.7 billion FY2025 | 19.2% | 35.9% | 26.8% |
| Rackspace Technology Inc. (RXT) | $2.7 billion FY2025 | -1.9% | -3.7% | -8.4% |
| Zscaler Inc. (ZS) | $2.7 billion FY2025 | 23.3% | -4.8% | -1.6% |
| WEX Inc. (WEX) | $2.7 billion FY2025 | 1.2% | 25.0% | 11.4% |
| Zillow Group Inc. (ZG) | $2.6 billion FY2025 | 15.5% | -1.3% | 0.9% |
| Nutanix Inc. (NTNX) | $2.5 billion FY2025 | 18.1% | 6.8% | 7.4% |
| Dropbox Inc. (DBX) | $2.5 billion FY2025 | -1.1% | 27.3% | 20.2% |
| FTAI Aviation Ltd. (FTAI) | $2.5 billion FY2025 | 44.5% | n/a | 20.0% |
| MongoDB Inc. (MDB) | $2.5 billion FY2026 | 22.8% | -5.6% | -2.9% |
| Jack Henry & Associates (JKHY) | $2.4 billion FY2025 | 7.2% | 23.9% | 19.2% |
| Tyler Technologies (TYL) | $2.3 billion FY2025 | 9.1% | 15.3% | 13.5% |
| FactSet (FDS) | $2.3 billion FY2025 | 5.4% | 32.2% | 25.7% |
| Alight Inc. (ALIT) | $2.3 billion FY2025 | -3.0% | -136.6% | -136.9% |
| Reddit (RDDT) | $2.2 billion FY2025 | 69.4% | 20.1% | 24.1% |
| Cloudflare Inc. (NET) | $2.2 billion FY2025 | 29.8% | -9.6% | -4.7% |
| TTEC Holdings Inc. (TTEC) | $2.1 billion FY2025 | -3.2% | -5.5% | -8.7% |
| ExlService Holdings Inc. (EXLS) | $2.1 billion FY2025 | 13.6% | 15.0% | 12.0% |
| Dynatrace Inc. (DT) | $2.0 billion FY2026 | 18.8% | 12.2% | 8.1% |
| Fair Isaac (FICO) | $2.0 billion FY2025 | 15.9% | 46.5% | 32.7% |
| Unisys Corporation (UIS) | $2.0 billion FY2025 | -2.9% | 4.0% | -17.4% |
| Unity Software Inc. (U) | $1.8 billion FY2025 | 2.0% | -25.9% | -21.8% |
| Pegasystems Inc. (PEGA) | $1.7 billion FY2025 | 16.6% | 15.1% | 22.5% |
| Elastic N.V. (ESTC) | $1.7 billion FY2026 | 17.3% | -1.9% | 21.1% |
| Verisign (VRSN) | $1.7 billion FY2025 | 6.4% | 67.7% | 49.8% |
| Samsara Inc. (IOT) | $1.6 billion FY2026 | 29.6% | -3.2% | -0.6% |
| TrueBlue Inc. (TBI) | $1.6 billion FY2025 | 3.1% | -2.9% | -3.0% |
| UiPath Inc. (PATH) | $1.6 billion FY2026 | 12.7% | 3.5% | 17.5% |
| Clear Channel Outdoor Holdings Inc. (CCO) | $1.6 billion FY2025 | 6.6% | 19.4% | 1.2% |
| Paylocity Holding Corporation (PCTY) | $1.6 billion FY2025 | 13.7% | 19.1% | 14.2% |
| TIC Solutions Inc. (TIC) | $1.5 billion FY2025 | n/a | -1.1% | -5.7% |
| Bentley Systems Incorporated (BSY) | $1.5 billion FY2025 | 11.0% | 24.1% | 18.5% |
| BILL Holdings Inc. (BILL) | $1.5 billion FY2025 | 13.4% | -5.5% | 1.6% |
| Kforce Inc. (KFRC) | $1.3 billion FY2025 | -5.4% | 3.8% | 2.6% |
| Procore Technologies Inc. (PCOR) | $1.3 billion FY2025 | 14.8% | -9.4% | -7.6% |
| Rubrik Inc. (RBRK) | $1.3 billion FY2026 | 48.5% | -26.2% | -0.0% |
| HealthEquity Inc. (HQY) | $1.3 billion FY2026 | 9.5% | 24.6% | 16.4% |
| Zeta Global Holdings Corp. (ZETA) | $1.3 billion FY2025 | 29.7% | 0.4% | -2.4% |
| Teads Holding Co. (TEAD) | $1.3 billion FY2025 | 46.1% | -30.7% | -39.8% |
| Tempus AI Inc. (TEM) | $1.3 billion FY2025 | 83.4% | -19.9% | -19.3% |
| Barrett Business Services Inc. (BBSI) | $1.2 billion FY2025 | 8.4% | 5.0% | 4.4% |
| Klaviyo Inc. (KVYO) | $1.2 billion FY2025 | 31.6% | -5.5% | -2.6% |
| Guidewire Software Inc. (GWRE) | $1.2 billion FY2025 | 22.6% | 3.4% | 5.8% |
| Paymentus Holdings Inc. (PAY) | $1.2 billion FY2025 | 37.3% | 6.3% | 5.6% |
| Commvault Systems Inc. (CVLT) | $1.2 billion FY2026 | 18.9% | 6.3% | 6.0% |
| TaskUs Inc. (TASK) | $1.2 billion FY2025 | 19.0% | 11.9% | 8.6% |
| MediaAlpha Inc. (MAX) | $1.1 billion FY2025 | 28.8% | 2.0% | 2.3% |
| RideNow Group Inc. (RDNW) | $1.1 billion FY2025 | -10.5% | -0.0% | -4.8% |
| Manhattan Associates Inc. (MANH) | $1.1 billion FY2025 | 3.7% | 25.9% | 20.3% |
| SailPoint Inc. (SAIL) | $1.1 billion FY2026 | 24.4% | -28.7% | -25.2% |
| CCC Intelligent Solutions Holdings Inc. (CCC) | $1.1 billion FY2025 | 11.9% | 8.9% | 0.2% |
| Figma Inc. (FIG) | $1.1 billion FY2025 | 41.0% | -122.2% | -118.4% |
| Duolingo Inc. (DUOL) | $1.0 billion FY2025 | 38.7% | 13.1% | 39.9% |
| Angi Inc. (ANGI) | $1.0 billion FY2025 | -13.0% | 6.3% | 4.3% |
| SentinelOne Inc. (S) | $1.0 billion FY2026 | 21.9% | -32.1% | -45.0% |
| Shutterstock Inc. (SSTK) | $990 million FY2025 | 5.8% | 7.6% | 4.6% |
| Getty Images Holdings Inc. (GETY) | $981 million FY2025 | 4.5% | 8.6% | -21.0% |
| Bumble Inc. (BMBL) | $966 million FY2025 | -9.9% | -83.4% | -71.8% |
| Claritev Corporation (CTEV) | $965 million FY2025 | 3.7% | 3.0% | -29.4% |
| ServiceTitan Inc. (TTAN) | $961 million FY2026 | 24.5% | -17.6% | -16.6% |
| GitLab Inc. (GTLB) | $955 million FY2026 | 25.8% | -7.4% | -6.1% |
| Priority Technology Holdings Inc. (PRTH) | $953 million FY2025 | 8.3% | 14.8% | 5.8% |
| AppFolio Inc. (APPF) | $951 million FY2025 | 19.7% | 16.1% | 14.8% |
| McGrath RentCorp (MGRC) | $944 million FY2025 | 3.7% | 25.8% | 16.6% |
| DigitalOcean Holdings Inc. (DOCN) | $901 million FY2025 | 15.5% | 17.4% | 28.8% |
| Workiva Inc. (WK) | $885 million FY2025 | 19.7% | -4.8% | -3.0% |
| Nutex Health Inc. (NUTX) | $875 million FY2025 | 82.4% | 31.5% | 8.1% |
| XBP Global Holdings Inc. (XBP) | $873 million FY2024 | n/a | -12.1% | -24.7% |
| Rapid7 Inc. (RPD) | $860 million FY2025 | 1.9% | 1.3% | 2.7% |
| Ribbon Communications Inc. (RBBN) | $845 million FY2025 | 1.3% | -0.4% | 0.0% |
| Freshworks Inc. (FRSH) | $839 million FY2025 | 16.4% | 1.6% | 21.9% |
| NerdWallet Inc. (NRDS) | $837 million FY2025 | 21.7% | 7.8% | 5.8% |
| GoodRx Holdings Inc. (GDRX) | $797 million FY2025 | 0.6% | 11.0% | 3.8% |
| Asana Inc. (ASAN) | $791 million FY2026 | 9.2% | -25.0% | -23.9% |
| Thryv Holdings Inc. (THRY) | $785 million FY2025 | -4.7% | 7.2% | 0.0% |
| ACV Auctions Inc. (ACVA) | $760 million FY2025 | 19.2% | -8.3% | -8.7% |
| Coursera Inc. (COUR) | $758 million FY2025 | 9.0% | -10.2% | -6.7% |
| Bandwidth Inc. (BAND) | $754 million FY2025 | 0.7% | -1.9% | -1.7% |
| Vertex Inc. (VERX) | $748 million FY2025 | 12.2% | 0.3% | 1.0% |
| Braze Inc. (BRZE) | $738 million FY2026 | 24.4% | -19.6% | -17.8% |
| 8x8 Inc (EGHT) | $736 million FY2026 | 2.9% | 2.6% | 0.2% |
| Appian Corporation (APPN) | $727 million FY2025 | 17.8% | 0.1% | 0.2% |
| Cars.com Inc. (CARS) | $723 million FY2025 | 0.6% | 8.3% | 2.8% |
| Magnite Inc. (MGNI) | $714 million FY2025 | 6.9% | 13.7% | 20.3% |
| Netskope Inc. (NTSK) | $709 million FY2026 | 31.7% | -92.0% | -95.8% |
| Navan Inc. (NAVN) | $702 million FY2026 | 30.8% | -28.0% | -56.7% |
| EverQuote Inc. (EVER) | $693 million FY2025 | 38.5% | 8.4% | 14.3% |
| Xometry Inc. (XMTR) | $687 million FY2025 | 25.9% | -6.6% | -9.0% |
| Qualys Inc. (QLYS) | $669 million FY2025 | 10.1% | 33.2% | 29.6% |
| Doximity Inc. (DOCS) | $645 million FY2026 | 13.1% | 33.3% | 30.4% |
| Marqeta Inc. (MQ) | $625 million FY2025 | 23.3% | -7.4% | -2.2% |
| Fastly Inc. (FSLY) | $624 million FY2025 | 14.8% | -19.1% | -19.5% |
| Varonis Systems Inc. (VRNS) | $624 million FY2025 | 13.2% | -23.5% | -20.7% |
| Flywire Corporation Voting (FLYW) | $623 million FY2025 | 26.6% | 1.8% | 2.2% |
| Applied Digital Corporation (APLD) | $611 million FY2026 | 167.5% | -38.7% | -40.9% |
| International Money Express Inc. (IMXI) | $608 million FY2025 | -7.7% | 9.2% | 5.4% |
| nCino Inc. (NCNO) | $595 million FY2026 | 10.0% | 0.6% | 1.6% |
| EverCommerce Inc. (EVCM) | $589 million FY2025 | 4.8% | 10.1% | 3.0% |
| Hinge Health Inc. (HNGE) | $588 million FY2025 | 50.6% | -92.9% | -89.9% |
| Nebius Group (NBIS) | $530 million FY2025 | 479.0% | -115.5% | 15.6% |
| Skillsoft Corp. (SKIL) | $513 million FY2026 | -3.5% | -17.5% | -27.3% |
| Intapp Inc. (INTA) | $504 million FY2025 | 17.1% | -5.4% | -3.6% |
| Groupon Inc. (GRPN) | $498 million FY2025 | 1.2% | 4.7% | -16.7% |
| PagerDuty Inc. (PD) | $493 million FY2026 | 5.4% | 1.2% | 35.1% |
| Phreesia Inc. (PHR) | $481 million FY2026 | 14.5% | -1.4% | 0.5% |
| Sprout Social Inc (SPT) | $458 million FY2025 | 12.7% | -9.5% | -9.5% |
| Resources Connection Inc. (RGP) | $452 million FY2026 | -18.0% | -8.5% | -9.0% |
| ZipRecruiter Inc. (ZIP) | $449 million FY2025 | -5.3% | -4.3% | -7.3% |
| Xperi Inc. (XPER) | $448 million FY2025 | -9.2% | -9.8% | -12.6% |
| Yext Inc. (YEXT) | $447 million FY2026 | 6.1% | 10.0% | 8.5% |
| Alkami Technology Inc. (ALKT) | $444 million FY2025 | 32.9% | -12.1% | -10.7% |
| Circle8 Group Inc. (CIRC) | $436 million FY2025 | -1.5% | -11.5% | -13.6% |
| Via Transportation Inc. (VIA) | $434 million FY2025 | 28.6% | -17.6% | -22.2% |
| Rimini Street Inc. (RMNI) | $422 million FY2025 | -1.7% | 14.2% | 8.8% |
| AvePoint Inc. (AVPT) | $419 million FY2025 | 26.9% | 7.9% | 8.3% |
| Grid Dynamics Holdings Inc. (GDYN) | $412 million FY2025 | 17.5% | -0.5% | 2.3% |
| 3D Systems Corporation (DDD) | $387 million FY2025 | -12.1% | -24.8% | 7.7% |
| comScore Inc. (SCOR) | $357 million FY2025 | 0.4% | 1.3% | -2.8% |
| Consensus Cloud Solutions Inc. (CCSI) | $350 million FY2025 | -0.2% | 43.0% | 24.2% |
| DLH Holdings Corp. (DLHC) | $344 million FY2025 | -13.0% | 4.9% | 0.4% |
| Viant Technology Inc. (DSP) | $344 million FY2025 | 19.0% | 3.5% | 2.4% |
| Amplitude Inc. (AMPL) | $343 million FY2025 | 14.7% | n/a | -25.8% |
| Ibotta Inc. (IBTA) | $342 million FY2025 | -6.8% | -0.2% | 1.0% |
| Commerce.com Inc. Series 1 (CMRC) | $342 million FY2025 | 2.8% | -4.7% | -5.6% |
| MarketWise Inc. (MKTW) | $328 million FY2025 | -19.7% | 19.1% | 1.7% |
| RCM Technologies Inc. (RCMT) | $319 million FY2025 | 14.7% | 7.9% | 5.1% |
| Health Catalyst Inc (HCAT) | $311 million FY2025 | 1.5% | -51.7% | -57.2% |
| Repay Holdings Corporation (RPAY) | $309 million FY2025 | -1.2% | -82.4% | -83.0% |
| Inspired Entertainment Inc. (INSE) | $304 million FY2025 | 2.4% | 10.0% | -5.6% |
| Katapult Holdings Inc. (KPLT) | $292 million FY2025 | 18.0% | -0.2% | 0.5% |
| MNTN Inc. (MNTN) | $290 million FY2025 | 28.6% | 8.3% | -2.2% |
| PubMatic Inc. (PUBM) | $283 million FY2025 | -2.9% | -6.1% | -4.9% |
| NPK International Inc. (NPKI) | $277 million FY2025 | 27.4% | 16.9% | 14.1% |
| Ooma Inc. (OOMA) | $274 million FY2026 | 6.5% | 1.6% | 2.4% |
| System1 Inc. (SST) | $266 million FY2025 | -22.6% | -23.3% | -24.6% |
| Nextdoor Holdings Inc. (NXDR) | $258 million FY2025 | 4.2% | -27.9% | -21.0% |
| Cerence Inc. (CRNC) | $252 million FY2025 | -24.0% | -0.9% | -7.4% |
| Innodata Inc. (INOD) | $252 million FY2025 | 47.6% | 15.8% | 12.8% |
| C3.ai Inc. (AI) | $250 million FY2026 | -35.7% | -199.2% | -188.0% |
| American Well Corporation (AMWL) | $249 million FY2025 | -2.0% | -42.2% | -38.4% |
| National CineMedia Inc. (NCMI) | $243 million FY2025 | 1.0% | -5.7% | -4.4% |
| OneSpan Inc. (OSPN) | $243 million FY2025 | 0.0% | 19.9% | 30.0% |
| Definitive Healthcare Corp. (DH) | $242 million FY2025 | -4.2% | -92.9% | -57.5% |
| Weave Communications Inc. (WEAV) | $239 million FY2025 | 17.0% | -12.8% | -11.7% |
| PLAYSTUDIOS Inc. (MYPS) | $235 million FY2025 | -18.8% | -10.2% | -12.2% |
| Cardlytics Inc. (CDLX) | $233 million FY2025 | -16.2% | -43.6% | -44.6% |
| Upland Software Inc. (UPLD) | $217 million FY2025 | -21.1% | 2.0% | 18.6% |
| i3 Verticals Inc. (IIIV) | $213 million FY2025 | 11.5% | 1.8% | 8.4% |
| Fluent Inc. (FLNT) | $209 million FY2025 | -18.0% | -9.7% | -13.0% |
| Cass Information Systems Inc (CASS) | $191 million FY2025 | 5.3% | n/a | 18.4% |
| Meridian Holdings Inc. (MRDN) | $183 million FY2025 | 21.0% | -52.6% | -50.3% |
| Kaltura Inc. (KLTR) | $181 million FY2025 | 1.2% | -2.7% | -6.7% |
| Star Equity Holdings Inc. (STRR) | $172 million FY2025 | 22.9% | -2.1% | -3.9% |
| SoundHound AI Inc (SOUN) | $169 million FY2025 | 99.4% | -13.8% | -0.0% |
| Telos Corporation (TLS) | $165 million FY2025 | 52.2% | -24.2% | -22.2% |
| Harte Hanks Inc. (HHS) | $160 million FY2025 | -13.9% | 0.2% | -0.5% |
| CS Disco Inc. (LAW) | $157 million FY2025 | 8.3% | -30.7% | -28.3% |
| Stem Inc. (STEM) | $156 million FY2025 | 8.1% | -35.6% | 88.2% |
| Smartbird Inc. (BIRD) | $152 million FY2025 | -19.7% | -52.4% | -50.7% |
| SmartRent Inc. (SMRT) | $152 million FY2025 | -12.9% | -42.0% | -39.8% |
| WidePoint Corporation (WYY) | $151 million FY2025 | 5.6% | -1.8% | -1.8% |
| Backblaze Inc. (BLZE) | $146 million FY2025 | 14.3% | -16.2% | -17.6% |
| Expensify Inc. (EXFY) | $142 million FY2025 | 2.1% | -12.7% | -15.1% |
| IonQ Inc. (IONQ) | $130 million FY2025 | 201.9% | -487.4% | -392.3% |
| DHI Group Inc. (DHX) | $128 million FY2025 | -9.9% | -8.9% | -10.6% |
| BigBear.ai Inc. (BBAI) | $128 million FY2025 | -19.3% | -167.5% | -230.3% |
| Blend Labs Inc. (BLND) | $124 million FY2025 | 6.8% | -17.6% | -5.5% |
| Bridger Aerospace Group Holdings Inc. (BAER) | $123 million FY2025 | 24.6% | n/a | 3.4% |
| CareCloud Inc. (CCLD) | $120 million FY2025 | 8.7% | 9.4% | 0.0% |
| Asure Software Inc (ASUR) | $119 million FY2023 | 24.3% | -2.5% | -7.7% |
| Stran & Company Inc. (SWAG) | $116 million FY2025 | 40.6% | -1.7% | -0.6% |
| CEVA Inc. (CEVA) | $110 million FY2025 | 2.5% | -10.4% | -9.7% |
| OptimizeRx Corporation (OPRX) | $109 million FY2025 | 18.8% | 10.7% | 4.7% |
| Firy Inc. (FIRY) | $104 million FY2025 | 12.5% | -61.2% | -67.4% |
| SoundThinking Inc. (SSTI) | $104 million FY2025 | 2.1% | -8.4% | -9.0% |
| RUM Group Inc. (RUM) | $101 million FY2025 | 5.4% | -125.9% | -81.3% |
| Nixxy Inc. (NIXX) | $98 million FY2025 | 1631666.7% | -12.0% | -15.3% |
| GEE Group Inc. (JOB) | $97 million FY2025 | -9.8% | -26.2% | -36.0% |
| Gloo Holdings Inc. (GLOO) | $95 million FY2026 | 307.7% | -114.3% | -166.0% |
| BGSF Inc. (BGSF) | $93 million FY2025 | -10.6% | -9.5% | -12.2% |
| Veritone Inc. (VERI) | $92 million FY2025 | -0.5% | -88.1% | -121.2% |
| Travelzoo (TZOO) | $92 million FY2025 | 9.3% | 7.5% | 5.1% |
| Red Violet Inc. (RDVT) | $90 million FY2025 | 20.0% | 14.6% | 14.6% |
| eGain Corporation (EGAN) | $88 million FY2025 | -4.7% | 5.0% | 36.5% |
| Inuvo Inc. (INUV) | $86 million FY2025 | 2.9% | -7.8% | -5.9% |
| Innovative Solutions and Support Inc. (IA) | $84 million FY2025 | 78.6% | 23.8% | 18.5% |
| Paysign Inc. (PAYS) | $82 million FY2025 | 40.5% | 9.0% | 9.2% |
| Snail Inc. (SNAL) | $81 million FY2025 | -3.8% | -21.3% | -33.5% |
| Simulations Plus Inc. (SLP) | $79 million FY2025 | 13.1% | -89.3% | -81.7% |
| NetSol Technologies Inc. (NTWK) | $73 million FY2025 | 13.4% | 4.8% | 4.0% |
| Silvaco Group Inc. (SVCO) | $63 million FY2025 | 5.7% | -72.8% | -65.3% |
| PodcastOne Inc. (PODC) | $62 million FY2026 | 18.3% | -4.3% | -4.3% |
| MicroAlgo Inc. (MLGO) | $60 million FY2025 | -20.3% | 5.3% | 30.2% |
| CSP Inc. (CSPI) | $59 million FY2025 | 6.4% | -5.3% | -0.2% |
| Creative Realities Inc. (CREX) | $57 million FY2025 | 12.5% | -15.5% | -14.5% |
| MicroCloud Hologram Inc. (HOLO) | $57 million FY2025 | 38.6% | 0.6% | -12.4% |
| Outdoor Holding Company (POWW) | $51 million FY2026 | 3.5% | -12.3% | -6.9% |
| Heritage Global Inc. (HGBL) | $51 million FY2025 | 12.4% | 11.2% | 7.0% |
| Research Solutions Inc (RSSS) | $49 million FY2025 | 9.9% | 5.1% | 2.6% |
| Marchex Inc. (MCHX) | $45 million FY2025 | -5.6% | -12.6% | -11.5% |
| Red Cat Holdings Inc. (RCAT) | $41 million FY2025 | n/a | -163.5% | -177.0% |
| AudioEye Inc. (AEYE) | $40 million FY2025 | 14.5% | -4.5% | -7.6% |
| Datavault AI Inc. (DVLT) | $39 million FY2025 | 1361.8% | -83.1% | -202.1% |
| FingerMotion Inc. (FNGR) | $36 million FY2024 | 5.1% | -10.7% | -10.6% |
| Direct Digital Holdings Inc. (DRCT) | $35 million FY2025 | -44.3% | -42.5% | -54.6% |
| IZEA Worldwide Inc. (IZEA) | $31 million FY2025 | -12.9% | -6.0% | 0.1% |
| HireQuest Inc. (HQI) | $31 million FY2025 | -11.4% | 20.5% | 20.7% |
| Duos Technologies Group Inc. (DUOT) | $27 million FY2025 | 271.2% | -36.1% | 0.0% |
| AiRWA Inc. (YYAI) | $26 million FY2026 | 101.3% | -23.7% | -68.0% |
| Where Food Comes From Inc. (WFCF) | $25 million FY2025 | -3.3% | 4.8% | 6.2% |
| D-Wave Quantum Inc. (QBTS) | $25 million FY2025 | 178.5% | -408.2% | -1444.1% |
| Intelligent Protection Management Corp. (IPM) | $24 million FY2025 | 2049.9% | -20.0% | -8.3% |
| Intellicheck Inc. (IDN) | $23 million FY2025 | 13.3% | 4.8% | 5.6% |
| ReposiTrak Inc. (TRAK) | $23 million FY2025 | 10.5% | 27.5% | 29.3% |
| XTI Aerospace Inc. (XTIA) | $22 million FY2025 | 602.4% | -190.4% | -305.7% |
| FatPipe Inc. (FATN) | $19 million FY2026 | 17.9% | 18.7% | 25.9% |
| Smith Micro Software Inc. (SMSI) | $17 million FY2025 | -15.5% | -167.1% | -0.2% |
| Aware Inc. (AWRE) | $17 million FY2025 | -0.6% | -37.9% | 34.0% |
| Eva Live Inc. (GOAI) | $17 million FY2025 | 82.6% | 48.2% | -47.7% |
| Rank One Computing Corporation (ROC) | $17 million FY2025 | 23.9% | -11.8% | -15.8% |
| Great Elm Group Inc. (GEG) | $16 million FY2025 | -8.5% | -49.1% | 79.0% |
| Bridgeline Digital Inc. (BLIN) | $15 million FY2025 | 0.2% | -15.8% | -16.4% |
| Airship AI Holdings Inc. (AISP) | $15 million FY2025 | -33.5% | -47.1% | 191.4% |
| Cycurion Inc. (CYCU) | $15 million FY2025 | -14.8% | -154.7% | -156.4% |
| Healthcare Triangle Inc. (HCTI) | $14 million FY2025 | 18.8% | -70.5% | -68.2% |
| Banzai International Inc. (PARA) | $12 million FY2025 | 168.6% | -151.8% | -184.9% |
| Super League Enterprise Inc. (SLE) | $11 million FY2025 | -29.9% | -115.1% | -182.7% |
| Motorsport Games Inc. (MSGM) | $11 million FY2025 | 30.0% | 28.8% | 61.3% |
| Onfolio Holdings Inc. (ONFO) | $11 million FY2025 | 36.5% | -25.7% | -24.1% |
| The OLB Group Inc. (OLB) | $9 million FY2025 | -32.4% | -59.5% | -67.7% |
| Fusemachines Inc. (FUSE) | $8 million FY2025 | -12.5% | -77.2% | -12.0% |
| Rigetti Computing Inc. (RGTI) | $7 million FY2025 | -34.3% | -1194.4% | -3050.4% |
| Exascale Labs Holdings Inc. (XLAB) | $7 million FY2025 | n/a | -43.4% | -109.2% |
| Datacentrex Inc. (DTCX) | $7 million FY2025 | 939640.5% | -113.7% | -122.1% |
| Professional Diversity Network Inc. (IPDN) | $7 million FY2025 | -2.7% | -98.6% | -98.5% |
| BIO-key International Inc. (BKYI) | $6 million FY2025 | -14.3% | -115.0% | 120.6% |
| Exyn Technologies Inc. (EXYN) | $6 million FY2025 | 4.4% | -166.2% | -209.8% |
| CID HoldCo Inc. (DAIC) | $6 million FY2025 | 3261.7% | -179.2% | -632.6% |
| Callan JMB Inc. (CJMB) | $6 million FY2025 | -12.8% | -122.9% | -139.2% |
| Iveda Solutions Inc. (IVDA) | $5 million FY2025 | -12.3% | -61.1% | -60.6% |
| Brightline Interactive Inc. (BTLN) | $5 million FY2025 | -40.2% | -52.1% | -48.5% |
| Palladyne AI Corp. (PDYN) | $5 million FY2025 | -32.6% | -617.7% | 191.4% |
| Cloudastructure Inc. (CSAI) | $5 million FY2025 | 271.4% | -160.8% | -167.0% |
| CXApp Inc. (CXAI) | $5 million FY2025 | -35.8% | -383.5% | -293977.7% |
| Algorhythm Holdings Inc. (RIME) | $4 million FY2025 | -81.3% | -181.0% | -361.4% |
| Ucommune International Ltd (UK) | $4 million FY2025 | -84.4% | -155.5% | -150.3% |
| Trump Media & Technology Group Corp. (DJT) | $4 million FY2025 | 1.8% | -15560.8% | -19343.4% |
| T Stamp Inc. (IDAI) | $3 million FY2025 | 1.9% | -244.0% | -265.2% |
| TEN Holdings Inc. (XHLD) | $3 million FY2025 | -9.4% | -432.5% | -628.5% |
| Aurora Innovation Inc. (AUR) | $3 million FY2025 | n/a | -30033.3% | -27200.0% |
| TaoWeave Inc. (TWAV) | $2 million FY2025 | 2.5% | -121.5% | -260.8% |
| Treasure Global Inc. (TGL) | $2 million FY2025 | -89.4% | -945.3% | -1003.1% |
| authID Inc. (AUID) | $2 million FY2025 | 130.2% | -889.6% | -878.8% |
| Gaxos.ai Inc. (GXAI) | $2 million FY2025 | 47901.7% | -254.3% | -201.8% |
| SharonAI Holdings Inc. (SHAZ) | $2 million FY2025 | 257.4% | -880.0% | -2529.2% |
| Data Storage Corporation (DTST) | $1 million FY2025 | 13.4% | -258.4% | 1389.4% |
| Aether Holdings Inc. (ATHR) | $1 million FY2025 | -4.1% | n/a | -227.5% |
| Change Agents Corporation (CHGA) | $1 million FY2024 | 6.2% | -363.1% | -592.7% |
| Firefly Neuroscience Inc. (AIFF) | $1 million FY2025 | 957.4% | -775.5% | -1741.0% |
| Pixelworks Inc. (PXLW) | $693,000 FY2025 | 0.4% | -1667.5% | -3246.6% |
| Quantum Computing Inc. (QUBT) | $682,000 FY2025 | 82.8% | -7489.3% | -2738.1% |
| FreeCast Inc. (CAST) | $628,149 FY2025 | 23.7% | -2189.8% | -2239.3% |
| Safe Pro Group Inc. (SPAI) | $606,681 FY2025 | -72.0% | -2397.6% | -2360.8% |
| Sports Entertainment Gaming Global Corporation (SEGG) | $559,590 FY2025 | -41.6% | -3193.0% | -3628.3% |
| Corvex Inc. (MOVE) | $433,000 FY2025 | -57.3% | -3580.4% | -4222.9% |
| Swarmer Inc (SWMR) | $309,920 FY2025 | -5.9% | -1650.8% | -2752.1% |
| Brand Engagement Network Inc. (BNAI) | $275,120 FY2025 | 175.7% | -4589.3% | -3135.2% |
| Veea Inc. (VEEA) | $222,018 FY2025 | 56.6% | -8483.7% | -2999.8% |
| Cyngn Inc. (CYN) | $218,976 FY2025 | -40.5% | -11731.1% | -10717.7% |
| Arrive AI Inc. (ARAI) | $113,250 FY2025 | n/a | n/a | -11325.7% |
| Amesite Inc. (AMST) | $110,459 FY2025 | -33.8% | -3262.4% | -5990.5% |
| Game Your Game Inc. (GYGY) | $58,505 FY2025 | 293.2% | -1831.4% | -1339.7% |
| Real Messenger Corporation (RMSG) | $29,472 FY2026 | n/a | -14023.1% | -13885.8% |
| Auddia Inc. (AUUD) | $0 FY2025 | n/a | n/a | n/a |
Revenue growth compares each company's latest fiscal year with the one before. Fiscal years do not always end on the same date, so treat close comparisons with care.
Where These Numbers Come From
Every figure on this page is a value Allegion reported in its own SEC filings, read from the SEC's XBRL data (accession 0001579241-26-000007 for fiscal year 2025). Ratios are computed from those reported values. Figures were retrieved on October 12, 2026; a later amendment or a new annual report can change them, and the filing itself always takes precedence over this summary.
Each fiscal year is labeled by the calendar year in which it ended, so a company that names the same period differently in its own filings (many retailers whose year ends in January) may use another label. A year is left out of the table when the SEC data set holds no value for it. A figure shown as "Not reported" means the company did not file a value under the standard tag Swoopr reads, not that the amount was zero. This page is educational and describes reported history only; it is not a forecast or a recommendation.
Frequently Asked Questions
Who are Allegion's competitors?
Companies sharing Allegion's SEC classification (SIC major group 73) include Alphabet (GOOGL), Microsoft (MSFT), Meta Platforms (META), Accenture (ACN), Oracle Corporation (ORCL). Its 10-K names the competitors it considers most relevant.
How does Allegion compare with its peers on margins?
Allegion's fiscal 2025 operating margin was 21.1%, against a peer median of -1.3%.
How are these peers chosen?
By the SEC Standard Industrial Classification code each company files under, within Swoopr's S&P 500 Equal Weight company set, falling back to the two-digit major group when fewer than two companies share the exact code. Classification codes are broad, so read the peer list as a screen, not a verdict.