
Direct Answer
SEC EDGAR classifies Abbott Laboratories under SIC code 2834 (Pharmaceutical Preparations). Among Swoopr's S&P 500 Equal Weight companies, 231 others share that classification; by latest reported revenue, Abbott Laboratories ranks 6 of 232. A filing classification is a starting point: a company's real competitors depend on its segments, which its 10-K describes.
How Does Abbott Laboratories Compare With Its Peers?
| Company | Revenue (latest FY) | Revenue growth | Operating margin | Net margin |
|---|---|---|---|---|
| Johnson & Johnson (JNJ) | $94.2 billion FY2025 | 6.0% | n/a | 28.5% |
| Eli Lilly (LLY) | $65.2 billion FY2025 | 44.7% | n/a | 31.7% |
| Pfizer (PFE) | $62.6 billion FY2025 | -1.6% | n/a | 12.4% |
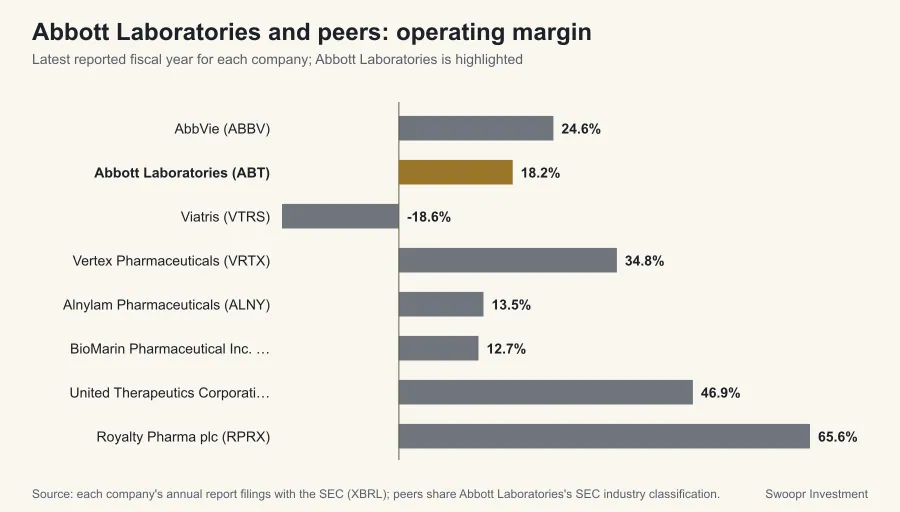
| AbbVie (ABBV) | $61.2 billion FY2025 | 8.6% | 24.6% | 6.9% |
| Bristol Myers Squibb (BMY) | $48.2 billion FY2025 | -0.2% | n/a | 14.6% |
| Abbott Laboratories (ABT) | $44.3 billion FY2025 | 5.7% | 18.2% | 14.7% |
| Viatris (VTRS) | $14.3 billion FY2025 | -3.0% | -18.6% | -24.6% |
| Vertex Pharmaceuticals (VRTX) | $12.0 billion FY2025 | 8.9% | 34.8% | 32.9% |
| Zoetis (ZTS) | $9.5 billion FY2025 | 2.3% | n/a | 28.2% |
| Organon & Co. (OGN) | $6.2 billion FY2025 | -2.9% | n/a | 3.0% |
| Elanco Animal Health Incorporated (ELAN) | $4.7 billion FY2025 | 6.2% | n/a | -4.9% |
| Alnylam Pharmaceuticals (ALNY) | $3.7 billion FY2025 | 65.2% | 13.5% | 8.4% |
| BioMarin Pharmaceutical Inc. (BMRN) | $3.2 billion FY2025 | 12.9% | 12.7% | 10.8% |
| United Therapeutics Corporation (UTHR) | $3.2 billion FY2025 | 10.6% | 46.9% | 41.9% |
| Royalty Pharma plc (RPRX) | $2.4 billion FY2025 | 5.1% | 65.6% | 32.4% |
| Madrigal Pharmaceuticals Inc. (MDGL) | $958 million FY2025 | 432.1% | -31.3% | -30.1% |
| Ionis Pharmaceuticals Inc. (IONS) | $944 million FY2025 | 33.8% | -40.4% | -40.4% |
| Arrowhead Pharmaceuticals Inc. (ARWR) | $829 million FY2025 | 23258.2% | 11.9% | -0.2% |
| Corcept Therapeutics Incorporated (CORT) | $761 million FY2025 | 12.8% | 5.9% | 13.1% |
| Emergent BioSolutions Inc. (EBS) | $743 million FY2025 | -28.8% | 13.5% | 7.1% |
| Kiniksa Pharmaceuticals International plc (KNSA) | $678 million FY2025 | 60.1% | 11.4% | 8.7% |
| Ultragenyx Pharmaceutical Inc. (RARE) | $673 million FY2025 | 20.2% | -79.5% | -85.4% |
| Axsome Therapeutics Inc. (AXSM) | $638 million FY2025 | 65.5% | -26.1% | -28.7% |
| OPKO Health Inc. (OPK) | $607 million FY2025 | -14.9% | -19.3% | -37187.0% |
| Insmed Incorporated (INSM) | $606 million FY2025 | 66.7% | -205.6% | -210.5% |
| Organogenesis Holdings Inc. (ORGO) | $564 million FY2025 | 17.0% | 7.9% | 6.6% |
| Mirum Pharmaceuticals Inc. (MIRM) | $521 million FY2025 | 54.7% | -4.2% | -4.5% |
| BridgeBio Pharma Inc. (BBIO) | $502 million FY2025 | 126.3% | -104.2% | -146.0% |
| Travere Therapeutics Inc. (TVTX) | $491 million FY2025 | 110.5% | -12.8% | -5.2% |
| Nature's Sunshine Products Inc. (NATR) | $480 million FY2025 | 5.7% | 5.2% | 4.1% |
| Ardelyx Inc. (ARDX) | $407 million FY2025 | 22.1% | -10.1% | -15.2% |
| Arcutis Biotherapeutics Inc. (ARQT) | $376 million FY2025 | 91.3% | -3.3% | -4.3% |
| MannKind Corporation (MNKD) | $349 million FY2025 | 22.2% | 11.1% | 1.7% |
| CorMedix Inc. (CRMD) | $312 million FY2025 | 617.0% | 48.2% | 52.3% |
| Evolus Inc. (EOLS) | $297 million FY2025 | 11.6% | -11.0% | -17.4% |
| Ironwood Pharmaceuticals Inc. (IRWD) | $296 million FY2025 | -15.7% | 33.3% | 8.1% |
| Rigel Pharmaceuticals Inc. (RIGL) | $294 million FY2025 | 64.1% | 42.6% | 124.7% |
| Xeris Biopharma Holdings Inc. (XERS) | $292 million FY2025 | 43.7% | 8.5% | 0.2% |
| Harrow Inc. (HROW) | $272 million FY2025 | 36.4% | 11.2% | -1.9% |
| Arvinas Inc. (ARVN) | $263 million FY2025 | -0.3% | -45.1% | -30.8% |
| Keros Therapeutics Inc. (KROS) | $244 million FY2025 | n/a | 27.7% | 35.7% |
| Akebia Therapeutics Inc. (AKBA) | $236 million FY2025 | 47.5% | 9.9% | -2.2% |
| AnaptysBio Inc. (ANAB) | $235 million FY2025 | 157.0% | 96.7% | -5.6% |
| Lifevantage Corporation (LFVN) | $229 million FY2025 | 14.2% | 5.3% | 4.3% |
| Puma Biotechnology Inc (PBYI) | $228 million FY2025 | -0.9% | 16.3% | 13.6% |
| IDEAYA Biosciences Inc. (IDYA) | $219 million FY2025 | 3024.4% | -72.8% | -52.0% |
| Vanda Pharmaceuticals Inc. (VNDA) | $216 million FY2025 | 8.7% | -70.0% | -102.0% |
| Rhythm Pharmaceuticals Inc. (RYTM) | $190 million FY2025 | 45.8% | -101.2% | -0.1% |
| Maravai LifeSciences Holdings Inc. (MRVI) | $186 million FY2025 | -28.3% | -115.9% | -70.4% |
| Stoke Therapeutics Inc. (STOK) | $184 million FY2025 | 404.5% | -11.2% | -3.7% |
| CryoPort Inc. (CYRX) | $176 million FY2025 | 12.4% | -20.9% | 44.4% |
| Phathom Pharmaceuticals Inc. (PHAT) | $175 million FY2025 | 216.9% | -91.4% | -0.1% |
| Syndax Pharmaceuticals Inc. (SNDX) | $172 million FY2025 | 627.8% | -158.4% | -165.6% |
| Heron Therapeutics Inc. (HRTX) | $155 million FY2025 | 7.4% | -1.6% | -12.9% |
| MacroGenics Inc. (MGNX) | $150 million FY2025 | -0.3% | -48.7% | -0.0% |
| Karyopharm Therapeutics Inc. (KPTI) | $146 million FY2025 | 0.6% | -62.1% | -134.2% |
| Lifecore Biomedical Inc. (LFCR) | $129 million FY2025 | 0.5% | -13.4% | -30.0% |
| Gyre Therapeutics Inc. (GYRE) | $117 million FY2025 | 10.2% | 9.9% | 8.5% |
| Zevra Therapeutics Inc. (ZVRA) | $106 million FY2025 | 350.9% | -59.1% | 78.2% |
| Zymeworks Inc. (ZYME) | $106 million FY2025 | 38.9% | -87.3% | -76.6% |
| SIGA Technologies Inc. (SIGA) | $95 million FY2025 | -31.8% | 25.1% | 24.6% |
| Cytokinetics Incorporated (CYTK) | $88 million FY2025 | 376.6% | -695.4% | -891.6% |
| Standard BioTools Inc. (LAB) | $85 million FY2025 | -6.2% | -129.2% | -87.8% |
| ARS Pharmaceuticals Inc. (SPRY) | $84 million FY2025 | -5.5% | -212.9% | -203.3% |
| Nurix Therapeutics Inc. (NRIX) | $84 million FY2025 | 54.0% | -340.2% | -314.9% |
| Eton Pharmaceuticals Inc. (ETON) | $80 million FY2025 | 104.9% | -1.1% | -5.8% |
| CytomX Therapeutics Inc. (CTMX) | $76 million FY2025 | -44.8% | -29.3% | -22.8% |
| Assembly Biosciences Inc. (ASMB) | $72 million FY2025 | 153.5% | -16.8% | -8.5% |
| Viridian Therapeutics Inc. (VRDN) | $71 million FY2025 | 23359.9% | -512.9% | -483.6% |
| Rockwell Medical Inc. (RMTI) | $69 million FY2025 | -31.8% | -6.8% | -7.7% |
| Kura Oncology Inc. (KURA) | $67 million FY2025 | 25.2% | -449.9% | -412.9% |
| Spero Therapeutics Inc. (SPRO) | $67 million FY2025 | 39.2% | 9.5% | 12.8% |
| Aytu BioPharma Inc. (AYTU) | $66 million FY2025 | 1.8% | -11.8% | -20.4% |
| Enanta Pharmaceuticals Inc. (ENTA) | $65 million FY2025 | -3.4% | -130.7% | -125.4% |
| Fortress Biotech Inc. (FBIO) | $63 million FY2025 | 9.7% | -111.0% | 58.5% |
| Nuvation Bio Inc. (NUVB) | $63 million FY2025 | 699.0% | -338.7% | -325.3% |
| Tango Therapeutics Inc. (TNGX) | $62 million FY2025 | 48.3% | -178.4% | -162.9% |
| Journey Medical Corporation (DERM) | $62 million FY2025 | 10.2% | -13.2% | -18.5% |
| Nektar Therapeutics (NKTR) | $55 million FY2025 | -43.9% | -253.7% | -296.9% |
| Agios Pharmaceuticals Inc. (AGIO) | $54 million FY2025 | 48.0% | -873.9% | -764.4% |
| Q32 Bio Inc. (QTTB) | $54 million FY2025 | n/a | 31.5% | 55.5% |
| Ocular Therapeutix Inc. (OCUL) | $52 million FY2025 | -18.5% | -519.8% | -511.9% |
| Lexicon Pharmaceuticals Inc. (LXRX) | $50 million FY2025 | 60.2% | -98.2% | -101.1% |
| Gossamer Bio Inc. (GOSS) | $48 million FY2025 | -57.7% | -352.2% | -351.5% |
| Septerna Inc. (SEPN) | $46 million FY2025 | 4174.5% | -148.6% | -106.4% |
| Aquestive Therapeutics Inc. (AQST) | $45 million FY2025 | -22.6% | -159.5% | -188.1% |
| Cumberland Pharmaceuticals Inc. (CPIX) | $45 million FY2025 | 17.6% | -6.3% | -6.4% |
| Xilio Therapeutics Inc. (XLO) | $44 million FY2025 | 589.9% | -95.9% | -80.1% |
| Palvella Therapeutics Inc. (PVLA) | $43 million FY2023 | 65.3% | -27.7% | 43.7% |
| Biofrontera Inc. (BFRI) | $42 million FY2025 | 11.7% | -27.2% | -25.3% |
| Equillium Inc. (EQ) | $41 million FY2024 | 13.9% | -20.1% | -19.6% |
| Verrica Pharmaceuticals Inc. (VRCA) | $36 million FY2025 | 370.2% | -34.2% | -50.3% |
| Verastem Inc. (VSTM) | $31 million FY2025 | 209.1% | -550.3% | -677.6% |
| Foghorn Therapeutics Inc. (FHTX) | $31 million FY2025 | 36.8% | -279.5% | -240.3% |
| Cue Biopharma Inc. (CUE) | $27 million FY2025 | 195.7% | -96.7% | -96.9% |
| Celularity Inc. (CELU) | $27 million FY2025 | -51.0% | -230.9% | -345.4% |
| Entrada Therapeutics Inc. (TRDA) | $25 million FY2025 | -87.9% | -621.1% | -565.5% |
| Alumis Inc. (ALMS) | $24 million FY2025 | n/a | -1886.9% | -1011.7% |
| SCYNEXIS Inc. (SCYX) | $21 million FY2025 | 449.9% | -78.0% | -41.8% |
| Veru Inc. (VERU) | $17 million FY2024 | 3.6% | -214.2% | -223.9% |
| Neuphoria Therapeutics Inc. (NEUP) | $16 million FY2025 | n/a | -7.2% | -2.4% |
| Opus Genetics Inc. (IRD) | $14 million FY2025 | 29.1% | -271.9% | -349.3% |
| Pyxis Oncology Inc. (PYXS) | $14 million FY2025 | -14.2% | -609.2% | -574.5% |
| Tonix Pharmaceuticals Holding Corp. (TNXP) | $13 million FY2025 | 29.8% | -959.1% | -946.2% |
| Evommune Inc. (EVMN) | $13 million FY2025 | 85.7% | -623.6% | -529.8% |
| Prelude Therapeutics Incorporated (PRLD) | $12 million FY2025 | 73.4% | -861.3% | -819.6% |
| Jaguar Health Inc. (JAGX) | $12 million FY2025 | -1.5% | -398.8% | -0.5% |
| Crescent Biopharma Inc. (CBIO) | $11 million FY2025 | n/a | -1407.5% | 1.4% |
| Janux Therapeutics Inc. (JANX) | $10 million FY2025 | -5.6% | -1576.7% | -1136.3% |
| Zenas BioPharma Inc. (ZBIO) | $10 million FY2025 | 100.0% | -3830.6% | -3777.4% |
| Precigen Inc. (PGEN) | $10 million FY2025 | 146.7% | -1141.1% | -2587.8% |
| Prothena Corporation plc (PRTA) | $10 million FY2025 | -92.8% | -2216.4% | -2520.6% |
| BioAge Labs Inc. (BIOA) | $9 million FY2025 | n/a | -1031.5% | -896.1% |
| Coya Therapeutics Inc. (COYA) | $8 million FY2025 | 123.6% | -283.9% | -267.1% |
| Aclaris Therapeutics Inc. (ACRS) | $8 million FY2025 | -58.2% | -975.9% | -829.6% |
| Pulmatrix Inc. (PULM) | $8 million FY2024 | 7.0% | -125.1% | -122.5% |
| Bolt Biotherapeutics Inc. (BOLT) | $8 million FY2025 | 0.1% | -469.3% | -433.7% |
| Ovid Therapeutics Inc. (OVID) | $7 million FY2025 | 1181.3% | -585.2% | -239.9% |
| Whitehawk Therapeutics Inc. (WHWK) | $7 million FY2025 | -72.5% | -1601.1% | -288.3% |
| Tvardi Therapeutics Inc. (TVRD) | $7 million FY2024 | -66.0% | -393.8% | -411.9% |
| Immunome Inc. (IMNM) | $7 million FY2025 | -23.2% | -3228.8% | -3060.0% |
| Kyntra Bio Inc. (KYNB) | $6 million FY2025 | -78.3% | -712.7% | 2848.6% |
| Korro Bio Inc. (KRRO) | $6 million FY2025 | 181.5% | -1906.4% | -1834.5% |
| Abeona Therapeutics Inc. (ABEO) | $6 million FY2025 | n/a | -1536.9% | -1223.1% |
| Ensysce Biosciences Inc. (ENSC) | $5 million FY2025 | -2.8% | -202.1% | -200.8% |
| CervoMed Inc. (CRVO) | $4 million FY2025 | -58.9% | -706.2% | -673.2% |
| Marker Therapeutics Inc. (MRKR) | $4 million FY2025 | -46.2% | -363.5% | -343.0% |
| CAMP4 Therapeutics Corporation (CAMP) | $3 million FY2025 | 436.5% | -1502.4% | -2298.5% |
| Aptevo Therapeutics Inc. (APVO) | $3 million FY2022 | n/a | -919.7% | 257.8% |
| TherapeuticsMD Inc. (TXMD) | $3 million FY2025 | 71.6% | -145.3% | -18.8% |
| Xenetic Biosciences Inc. (XBIO) | $3 million FY2025 | 19.0% | -95.2% | -90.1% |
| Upstream Bio Inc. (UPB) | $3 million FY2025 | 20.4% | -5618.8% | -5026.0% |
| Cartesian Therapeutics Inc. (RNAC) | $3 million FY2025 | -92.8% | -5127.1% | -4658.6% |
| Traws Pharma Inc. (TRAW) | $3 million FY2025 | 1134.5% | -640.7% | 328.7% |
| GeoVax Labs Inc. (GOVX) | $2 million FY2025 | -37.1% | -869.3% | -862.3% |
| Elicio Therapeutics Inc. (ELTX) | $2 million FY2022 | n/a | -1031.4% | -1225.9% |
| Korsana Biosciences Inc. (KRSA) | $2 million FY2025 | 3.7% | -239.8% | -170.1% |
| Dianthus Therapeutics Inc. (DNTH) | $2 million FY2025 | -67.3% | -8739.3% | -7973.3% |
| Sagimet Biosciences Inc. (SGMT) | $2 million FY2023 | n/a | -1537.0% | -1393.8% |
| Lipocine Inc. (LPCN) | $2 million FY2025 | -82.3% | -524.7% | -487.2% |
| Rani Therapeutics Holdings Inc. (RANI) | $2 million FY2025 | 58.9% | -2346.0% | -1817.1% |
| Perspective Therapeutics Inc. (CATX) | $1 million FY2023 | n/a | -2855.0% | -3243.2% |
| IGC Pharma Inc. (IGC) | $1 million FY2025 | -5.5% | -585.8% | -560.3% |
| Vistagen Therapeutics Inc. (VTGN) | $1 million FY2026 | 161.1% | -5683.7% | -5491.9% |
| NRX Pharmaceuticals Inc. (NRXP) | $1 million FY2025 | n/a | -1324.4% | -2336.5% |
| Longeveron Inc. (LGVN) | $1 million FY2025 | -49.9% | -1942.2% | -1893.6% |
| Matinas Biopharma Holdings Inc. (MTNB) | $1 million FY2023 | -65.6% | -2168.4% | -2093.2% |
| Dare Bioscience Inc. (DARE) | $1 million FY2025 | 10429.4% | -1315.5% | -1300.7% |
| 60 Degrees Pharmaceuticals Inc. (SXTP) | $1 million FY2025 | 65.5% | -771.6% | -732.5% |
| Shattuck Labs Inc. (STTK) | $1 million FY2025 | -82.5% | -5150.8% | -4880.9% |
| Rafael Holdings Inc. (RFL) | $917,000 FY2025 | 44.0% | -3179.8% | -3328.2% |
| Rallybio Corporation (RLYB) | $858,000 FY2025 | 34.9% | -3853.6% | -1046.4% |
| Onconetix Inc. (ONCO) | $815,371 FY2025 | -67.7% | -2190.0% | -1721.0% |
| Seres Therapeutics Inc. (MCRB) | $789,000 FY2025 | n/a | -11910.1% | 721.9% |
| Valion Bio Inc. (VBIO) | $780,000 FY2024 | -33.7% | -573.8% | -725.0% |
| Unicycive Therapeutics Inc. (UNCY) | $675,000 FY2023 | -29.0% | -3077.6% | -4525.0% |
| PMGC Holdings Inc. (ELAB) | $590,084 FY2025 | n/a | n/a | -1313.0% |
| Ernexa Therapeutics Inc. (ERNA) | $582,000 FY2024 | 755.9% | -2693.1% | -7652.7% |
| Yarrow Bioscience Inc. (YARW) | $570,000 FY2025 | 13.8% | -5219.1% | -4646.1% |
| Imunon Inc. (IMNN) | $500,000 FY2022 | n/a | -4984.3% | -7179.6% |
| Pasithea Therapeutics Corp. (KTTA) | $486,559 FY2022 | n/a | -2587.3% | -2864.3% |
| Scienture Holdings Inc. (SCNX) | $431,609 FY2025 | 215.9% | -9867.9% | -9618.0% |
| Medicinova Inc (MNOV) | $409,657 FY2025 | n/a | -3242.5% | 2928.8% |
| iBio Inc. (IBIO) | $400,000 FY2025 | 77.8% | -4650.5% | -4595.0% |
| Allarity Therapeutics Inc. (ALLR) | $320,000 FY2025 | n/a | -3939.1% | -3509.7% |
| Vyome Holdings Inc. (HIND) | $319,714 FY2025 | 24.4% | -3269.4% | -3209.7% |
| ABVC BioPharma Inc. (ABVC) | $296,000 FY2025 | -41.9% | -2416.0% | -2671.8% |
| Geron Corporation (GERN) | $237,000 FY2023 | -60.2% | -81832.9% | -77690.7% |
| Anixa Biosciences Inc. (ANIX) | $210,000 FY2024 | 0.0% | -6586.2% | -5978.1% |
| Clene Inc. (CLNN) | $200,000 FY2025 | -41.5% | -11541.5% | -13086.5% |
| Lisata Therapeutics Inc. (LSTA) | $170,000 FY2025 | -83.0% | -10711.2% | -10000.0% |
| Serina Therapeutics Inc. (SER) | $130,000 FY2025 | 132.1% | -18478.5% | -14755.4% |
| Soligenix Inc. (SNGX) | $119,371 FY2024 | -85.8% | -7907.7% | -6953.1% |
| Bullfrog AI Holdings Inc. (BFRG) | $116,670 FY2025 | n/a | -5652.4% | -5569.6% |
| Actinium Pharmaceuticals Inc. (Delaware) (ATNM) | $90,000 FY2025 | n/a | -40274.4% | -37652.2% |
| Citius Pharmaceuticals Inc. (CTXR) | $90,000 FY2022 | n/a | -37017.8% | -37378.5% |
| Silo Pharma Inc. (SILO) | $72,102 FY2025 | 0.0% | -5937.0% | -5863.5% |
| Inovio Pharmaceuticals Inc. (INO) | $65,343 FY2025 | -70.0% | -132871.3% | -130082.8% |
| Avalo Therapeutics Inc. (AVTX) | $59,000 FY2025 | -86.6% | -123601.7% | -132642.4% |
| Gain Therapeutics Inc. (GANX) | $55,180 FY2023 | -60.6% | -40328.3% | -40354.3% |
| HCW Biologics Inc. (HCWB) | $54,232 FY2025 | -97.9% | -24270.7% | -14677.1% |
| Altimmune Inc. (ALT) | $41,000 FY2025 | 105.0% | -230461.0% | -214861.0% |
| NeOnc Technologies Holdings Inc. (NTHI) | $39,990 FY2025 | -51.8% | -145637.5% | -155404.4% |
| Oragenics Inc. (OGEN) | $37,653 FY2023 | -71.4% | -55519.9% | -54858.1% |
| Lyell Immunopharma Inc. (LYEL) | $36,000 FY2025 | -41.0% | -748344.4% | -762355.6% |
| Talphera Inc. (TLPH) | $28,000 FY2025 | n/a | -48157.1% | -51035.7% |
| Jupiter Neurosciences Inc. (JUNS) | $21,796 FY2025 | n/a | -40873.2% | -39662.8% |
| Genelux Corporation (GNLX) | $8,000 FY2025 | 0.0% | -415175.0% | -401812.5% |
| Aspire-Lakewood Holdings Inc. (ASBP) | $6,202 FY2025 | n/a | -312016.9% | -394725.1% |
| Alaunos Therapeutics Inc. (TCRT) | $5,000 FY2025 | -50.0% | -84500.0% | -83520.0% |
| Aardvark Therapeutics Inc. (AARD) | $0 FY2025 | n/a | n/a | n/a |
| ALX Oncology Holdings Inc. (ALXO) | $0 FY2022 | n/a | n/a | n/a |
| Amylyx Pharmaceuticals Inc. (AMLX) | $0 FY2025 | -100.0% | n/a | n/a |
| Annovis Bio Inc. (ANVS) | $0 FY2025 | n/a | n/a | n/a |
| Benitec Biopharma Inc. (BNTC) | $0 FY2024 | -100.0% | n/a | n/a |
| BeyondSpring Inc. (BYSI) | $0 FY2025 | n/a | n/a | n/a |
| Capricor Therapeutics Inc. (CAPR) | $0 FY2025 | -100.0% | n/a | n/a |
| Contineum Therapeutics Inc. (CTNM) | $0 FY2024 | -100.0% | n/a | n/a |
| Corbus Pharmaceuticals Holdings Inc. (CRBP) | $0 FY2022 | n/a | n/a | n/a |
| Decoy Therapeutics Inc. (DCOY) | $0 FY2022 | n/a | n/a | n/a |
| Design Therapeutics Inc. (DSGN) | $0 FY2025 | n/a | n/a | n/a |
| Exicure Inc. (XCUR) | $0 FY2025 | -100.0% | n/a | n/a |
| Fulcrum Therapeutics Inc. (FULC) | $0 FY2025 | -100.0% | n/a | n/a |
| Genprex Inc. (GNPX) | $0 FY2024 | n/a | n/a | n/a |
| Immuneering Corporation (IMRX) | $0 FY2023 | -100.0% | n/a | n/a |
| KALA BIO Inc. (KALA) | $0 FY2025 | n/a | n/a | n/a |
| Kiora Pharmaceuticals Inc. (KPRX) | $0 FY2025 | -100.0% | n/a | n/a |
| Lite Strategy Inc. (LITS) | $0 FY2025 | -100.0% | n/a | n/a |
| Minerva Neurosciences Inc (NERV) | $0 FY2024 | n/a | n/a | n/a |
| Moleculin Biotech Inc. (MBRX) | $0 FY2025 | n/a | n/a | n/a |
| Monopar Therapeutics Inc. (MNPR) | $0 FY2025 | n/a | n/a | n/a |
| NanoViricides Inc. (NNVC) | $0 FY2025 | n/a | n/a | n/a |
| Nkarta Inc. (NKTX) | $0 FY2025 | n/a | n/a | n/a |
| Obsidian Therapeutics Inc. (OBX) | $0 FY2025 | n/a | n/a | n/a |
| OnKure Therapeutics Inc. (OKUR) | $0 FY2024 | n/a | n/a | n/a |
| Oruka Therapeutics Inc. (ORKA) | $0 FY2023 | n/a | n/a | n/a |
| Palatin Technologies Inc. (PTN) | $0 FY2025 | -100.0% | n/a | n/a |
| Pliant Therapeutics Inc. (PLRX) | $0 FY2025 | n/a | n/a | n/a |
| Praxis Precision Medicines Inc. (PRAX) | $0 FY2025 | -100.0% | n/a | n/a |
| Processa Pharmaceuticals Inc. (PCSA) | $0 FY2022 | n/a | n/a | n/a |
| Rein Therapeutics Inc. (RNTX) | $0 FY2025 | n/a | n/a | n/a |
| Rocket Pharmaceuticals Inc. (RCKT) | $0 FY2025 | n/a | n/a | n/a |
| SELLAS Life Sciences Group Inc. (SLS) | $0 FY2023 | -100.0% | n/a | n/a |
| Spruce Biosciences Inc. (SPRB) | $0 FY2025 | -100.0% | n/a | n/a |
| Spyre Therapeutics Inc. (SYRE) | $0 FY2025 | n/a | n/a | n/a |
| Summit Therapeutics Inc. (SMMT) | $0 FY2024 | n/a | n/a | n/a |
| Tenax Therapeutics Inc. (TENX) | $0 FY2025 | n/a | n/a | n/a |
| TuHURA Biosciences Inc. (HURA) | $0 FY2025 | n/a | n/a | n/a |
| Viking Therapeutics Inc. (VKTX) | $0 FY2025 | n/a | n/a | n/a |
| vTv Therapeutics Inc. (VTVT) | $0 FY2025 | -100.0% | n/a | n/a |
| XBiotech Inc. (XBIT) | $0 FY2023 | -100.0% | n/a | n/a |
| Zentalis Pharmaceuticals Inc. (ZNTL) | $0 FY2025 | -100.0% | n/a | n/a |
Revenue growth compares each company's latest fiscal year with the one before. Fiscal years do not always end on the same date, so treat close comparisons with care.
How Does Abbott Laboratories Rank Among All SEC Filers in Its Industry Code?
190 companies with annual reports in Swoopr's SEC dataset share SIC code 2834 (Pharmaceutical Preparations), a wider group than the S&P 500 Equal Weight companies above. Ranks run from 1 (highest) and use each company's latest fiscal year, in U.S. dollars.
| Measure | Abbott Laboratories | Median of filers | Rank |
|---|---|---|---|
| Revenue | $44.3 billion | $27 million | 6 of 190 |
| Revenue growth | 5.7% | 11.1% | 96 of 166 |
| Operating margin | 18.2% | -339.4% | 12 of 182 |
| Net margin | 14.7% | -202.0% | 21 of 190 |
A SIC code reflects the filer's main business as the SEC records it, so the group mixes companies of very different size; the median is a better guide than the average, and a rank near the top by revenue says nothing about quality.
Where These Numbers Come From
Every figure on this page is a value Abbott Laboratories reported in its own SEC filings, read from the SEC's XBRL data (accession 0001628280-26-010185 for fiscal year 2025). Ratios are computed from those reported values. Figures were retrieved on October 7, 2026; a later amendment or a new annual report can change them, and the filing itself always takes precedence over this summary.
Each fiscal year is labeled by the calendar year in which it ended, so a company that names the same period differently in its own filings (many retailers whose year ends in January) may use another label. A year is left out of the table when the SEC data set holds no value for it. A figure shown as "Not reported" means the company did not file a value under the standard tag Swoopr reads, not that the amount was zero. This page is educational and describes reported history only; it is not a forecast or a recommendation.
Frequently Asked Questions
Who are Abbott Laboratories's competitors?
Companies sharing Abbott Laboratories's SEC classification (SIC code 2834 (Pharmaceutical Preparations)) include Johnson & Johnson (JNJ), Eli Lilly (LLY), Pfizer (PFE), AbbVie (ABBV), Bristol Myers Squibb (BMY). Its 10-K names the competitors it considers most relevant.
How does Abbott Laboratories compare with its peers on margins?
Abbott Laboratories's fiscal 2025 operating margin was 18.2%, against a peer median of -340.2%.
How are these peers chosen?
By the SEC Standard Industrial Classification code each company files under, within Swoopr's S&P 500 Equal Weight company set, falling back to the two-digit major group when fewer than two companies share the exact code. Classification codes are broad, so read the peer list as a screen, not a verdict.
How does Abbott Laboratories rank among all companies in its SEC industry?
Among 190 SEC filers under SIC code 2834, Abbott Laboratories ranks 6 by latest revenue, and 12 of 182 by operating margin (18.2% against a median of -339.4%).