
What Are 10x Genomics Inc.'s Key Financial Figures?
| Fiscal year | FY2025 ended December 31, 2025 | FY2024 ended December 31, 2024 | FY2023 ended December 31, 2023 | FY2022 ended December 31, 2022 |
|---|---|---|---|---|
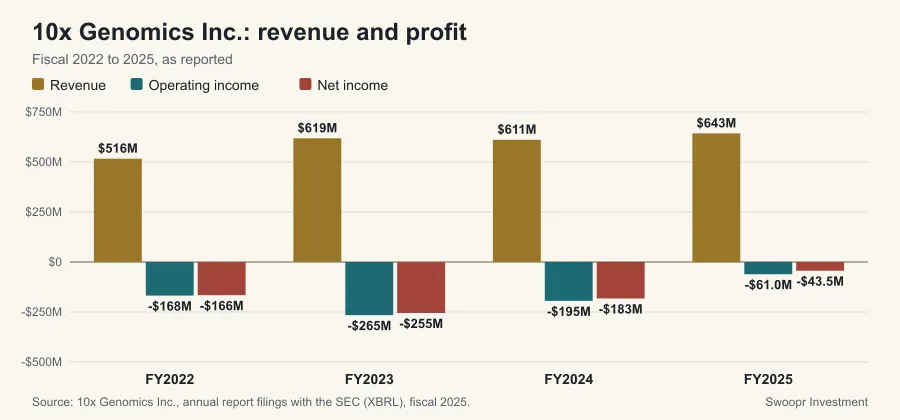
| Revenue | $643 million | $611 million | $619 million | $516 million |
| Operating income | -$61 million | -$195 million | -$265 million | -$168 million |
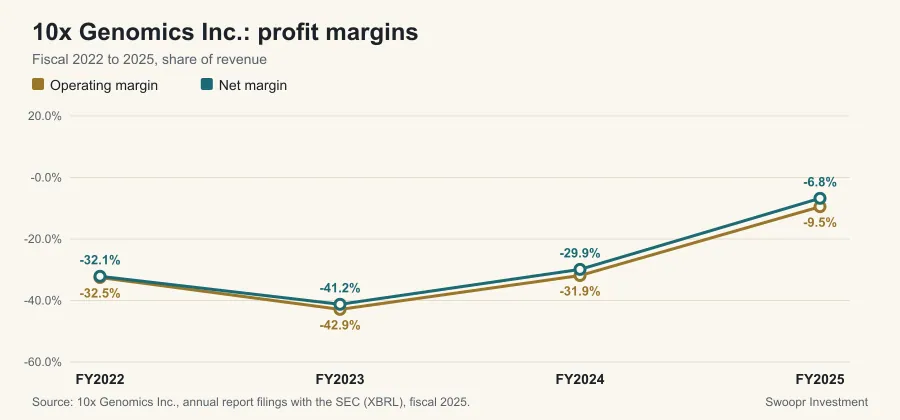
| Operating margin | -9.5% | -31.9% | -42.9% | -32.5% |
| Net income | -$44 million | -$183 million | -$255 million | -$166 million |
| Net margin | -6.8% | -29.9% | -41.2% | -32.1% |
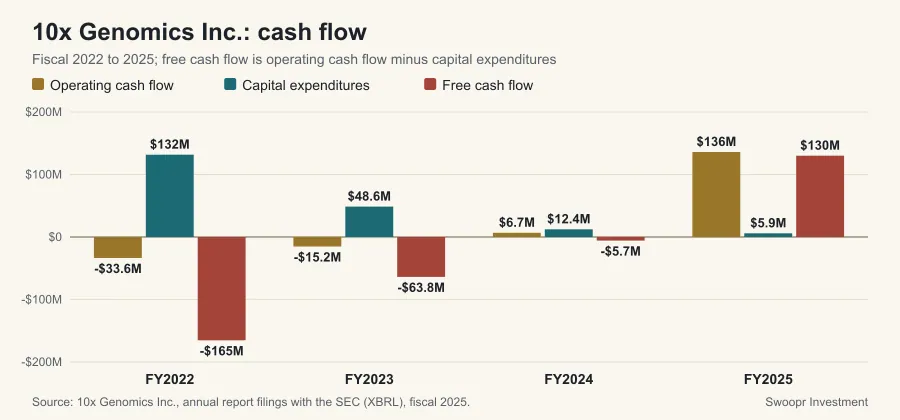
| Operating cash flow | $136 million | $7 million | -$15 million | -$34 million |
| Capital expenditures | $6 million | $12 million | $49 million | $132 million |
| Free cash flow | $130 million | -$6 million | -$64 million | -$165 million |
Operating margin widened by 22.4 percentage points between fiscal 2024 and 2025, which separates pricing and cost discipline from revenue growth alone. Free cash flow (operating cash flow minus capital expenditures) was $130 million against net income of -$44 million; cash generation covered reported earnings.
What Does 10x Genomics Inc.'s Balance Sheet Show?
| Cash and cash equivalents | $474 million |
|---|---|
| Long-term debt | Not reported |
| Total assets | $1.0 billion |
| Total liabilities | $245 million |
| Shareholders' equity | $796 million |
| Current ratio | 4.5x |
Balance sheet values are as of the end of fiscal 2025. Income statement figures describe a whole year; balance sheet figures describe a single day, so the two answer different questions.
Where These Numbers Come From
Every figure on this page is a value 10x Genomics Inc. reported in its own SEC filings, read from the SEC's XBRL data (accession 0001628280-26-007822 for fiscal year 2025). Ratios are computed from those reported values. Figures were retrieved on October 7, 2026; a later amendment or a new annual report can change them, and the filing itself always takes precedence over this summary.
Each fiscal year is labeled by the calendar year in which it ended, so a company that names the same period differently in its own filings (many retailers whose year ends in January) may use another label. A year is left out of the table when the SEC data set holds no value for it. A figure shown as "Not reported" means the company did not file a value under the standard tag Swoopr reads, not that the amount was zero. This page is educational and describes reported history only; it is not a forecast or a recommendation.
Frequently Asked Questions
What was 10x Genomics Inc.'s revenue in fiscal 2025?
10x Genomics Inc. reported revenue of $643 million for the fiscal year ended December 31, 2025, according to its SEC filings.
What is 10x Genomics Inc.'s operating margin?
10x Genomics Inc.'s operating margin was -9.5% in fiscal 2025: operating income of -$61 million on revenue of $643 million.
How much free cash flow did 10x Genomics Inc. generate?
Operating cash flow of $136 million less capital expenditures of $6 million gives free cash flow of $130 million for fiscal 2025.