
This is a content brief and source checklist, not a completed analysis. The sections below outline what the finished note will cover and exactly which primary sources will support it.
Original publication date: August 21, 2026. Data as-of date: Not yet available. No primary-source data has been pulled for this brief. Last reviewed: August 21, 2026.
Direct Answer
This page is a research brief for a Margin/Unit Economics Review on Chipotle Mexican Grill, Inc. (CMG). It is not yet a completed analysis: no figures below have been pulled from a primary source, and none are stated.
See “What This Note Is Teaching” below for the specific research skill this brief demonstrates, and “Primary Sources to Review” for exactly what the completed note will draw from.
What This Note Is Teaching
How to evaluate a restaurant or retail concept at the unit level: average unit volume, restaurant-level margin, and new-unit payback, rather than only company-wide aggregates that can hide store-level economics.
Company Snapshot
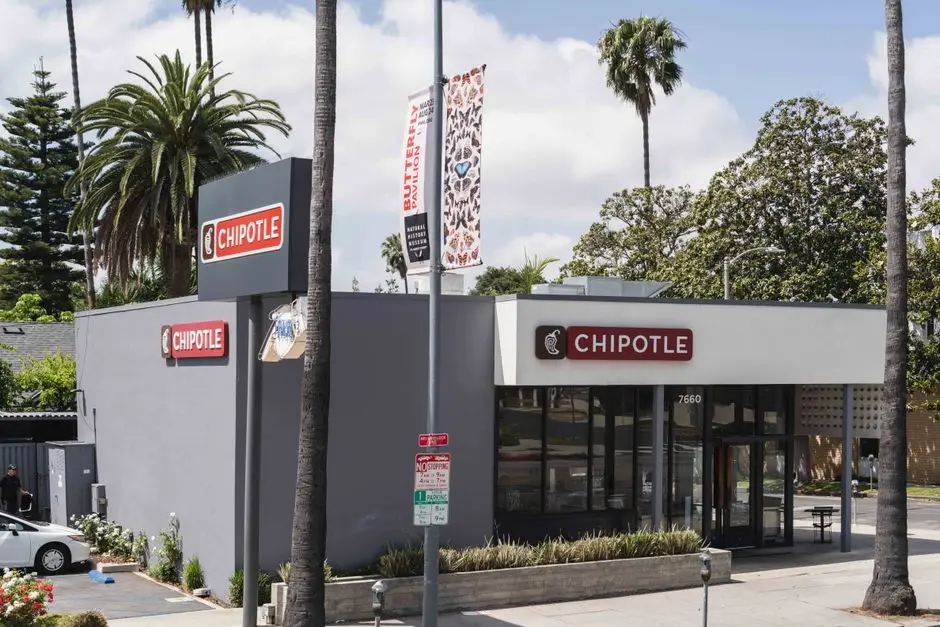
Chipotle Mexican Grill, Inc. operates and, to a much smaller extent, licenses fast-casual Mexican-style restaurants, predominantly company-operated rather than franchised. It trades on the NYSE under CMG.
| Field | Value |
|---|---|
| Ticker / symbol | CMG |
| Exchange | NYSE |
| Asset type | Stock |
| Sector | Restaurants |
| Note family | Margin/Unit Economics Review |
| Profile | large-cap, profitable, mature, company-operated store model, unit-economics-driven |
Primary Sources to Review
The finished note will be built from these primary documents, not from a secondary summary or another publisher's report:
- Most recent Form 10-K and Form 10-Q
- Most recent earnings call transcript for restaurant-level margin commentary
- Investor presentations discussing unit economics and new-unit returns
- Same-store sales disclosures across recent quarters for trend context
Start with the SEC's own full-text filing search or, for a fund, its own prospectus and shareholder reports, linked in References below.
Revenue Model & Segment Drivers
Pending primary-source data pull. The completed note will describe how Chipotle Mexican Grill, Inc. generates revenue, which segments or product lines drive growth, and how that mix has moved over the periods reviewed, cited to the filings listed above.
Financial Trend Table
| Period | Revenue | Growth | Margin |
|---|---|---|---|
| Pending | Pending primary-source data pull | Pending primary-source data pull | Pending primary-source data pull |
Cash Flow & Balance-Sheet Observations
Pending primary-source data pull. The completed note will summarize cash generation, balance-sheet structure, and any material observations from the primary filing, with every figure traceable to a named source.
Share Count & Capital-Allocation History
Pending primary-source data pull. The completed note will describe how the share count or fund size has changed over time and what that implies about dilution, buybacks, or fund flows.
Peer Context
Companies the completed note will compare Chipotle Mexican Grill, Inc. against on the same metrics, once those figures are pulled from each peer's own primary filings:
- Shake Shack Inc. (SHAK)
- Wingstop Inc. (WING)
- Cava Group, Inc. (CAVA)
Valuation Scenarios
The completed note will populate the scenario table below with explicit, visible assumptions for each case. No value is populated yet.
| Scenario | Key assumption | Resulting value |
|---|---|---|
| Bear case | Pending primary-source data pull | Pending primary-source data pull |
| Base case | Pending primary-source data pull | Pending primary-source data pull |
| Bull case | Pending primary-source data pull | Pending primary-source data pull |
Risks & Contrary Evidence
General risk categories relevant to this business, to be substantiated with specific, sourced evidence once the completed note is written:
- Labor cost and minimum-wage sensitivity given the company-operated model
- Food-cost input inflation risk
- Same-store sales deceleration risk in a weaker consumer environment
- Food-safety and reputational risk specific to the restaurant industry
Open Questions
- What is the reported average unit volume and how has it trended?
- What is restaurant-level operating margin, and what are its largest cost components?
- How long does a new restaurant take to reach a mature sales run-rate, based on disclosed cohort data if available?
What New Information Would Change This Analysis
- A disclosed average unit volume or restaurant-level margin materially different from the trend this note will document
- A new labor-cost or minimum-wage disclosure affecting the cost structure
- A same-store sales result that breaks from the pattern established here
Source List With Dates
Not yet compiled. This brief has not had a primary-source data pull; see Primary Sources to Review above for what the completed note will cite, each with its own filing date once reviewed.
Change Log
| Date | Change |
|---|---|
| 2026-08-21 | Brief created by the Swoopr Editorial Team. Primary-source data pull and full analysis pending. |
Related Reading
- Research Workbench: the repeatable research process this note follows, screen, compare, value, stress-test, document.
- Research Methodology & Formula Definitions: how Swoopr defines every metric this note will use once completed.
- Research Workbench tool: document your own thesis for Chipotle Mexican Grill, Inc. using the same eight-step framework.
- Fundamental Analysis: financial statements, valuation, moats, and capital efficiency in depth.
- How to Analyze a Stock: the broader multi-method decision framework this note's fundamentals fit into.
Frequently Asked Questions
What is a Margin/Unit Economics Review?
What drives a business’s margin structure at the unit level.
Why isn’t the Chipotle Mexican Grill, Inc. note finished yet?
This page is a research brief: an outline of what the finished note will cover and exactly which primary sources will support it, published before the data pull rather than after. Swoopr’s live data integrations do not include an archived source for the figures this note needs, and the site’s editorial policy does not allow publishing a number that has not been pulled from a named primary source. See the Primary Sources to Review section on this page for the specific documents the completed note will draw from.
Where does Swoopr source the data for research notes?
Swoopr’s research notes are built from primary filings and disclosures, such as SEC filings, a fund’s own prospectus, or an issuer’s own investor relations materials, never from competitor stock reports or secondary summaries. See the References section on this page for where to start, and the Research Methodology page for the full research process this note follows.
What are unit economics, and why analyze a business at that level?
Unit economics describe the revenue, costs and returns of a single location, customer or transaction rather than the consolidated company. For a business that grows by replicating a format, the consolidated figures are the sum of many units at different maturities, which blends a strong format with a weak one during expansion. Working at the unit level separates how well the format works from how fast it is being rolled out.
Why is same-store sales growth reported separately from total revenue growth?
Because total revenue rises whenever new locations open, regardless of how the existing ones are performing. The same-store measure covers only units open across both comparison periods, so it isolates the trend at the established base. A company with strong total growth and flat same-store growth is expanding rather than improving, which is a different business trajectory with different capital requirements.
How is same-store sales growth decomposed?
Into transaction count and average transaction value, and the split carries most of the information. Growth driven by more visits indicates demand; growth driven entirely by higher prices indicates pricing, which can hold for a while and can also mask declining traffic. Companies that disclose the two components make this readable directly; where only the combined figure is given, the decomposition has to be inferred from commentary.
What does a payback period on a new unit measure?
How long the cash generated by a new location takes to recover the capital spent building it. It compresses the return on an expansion program into a single comparable figure and determines how fast the business can grow from internally generated cash. A lengthening payback period, whether from higher build costs or lower unit volumes, changes the economics of expansion before it appears in consolidated results.
Why does a margin analysis separate fixed from variable costs?
Because they respond differently to volume, and the mix determines operating leverage. Costs that scale with each transaction compress margin only if their input prices rise. Costs fixed per location spread across more volume as sales grow, expanding margin, and work in reverse when volume falls. A margin change is therefore interpretable only when it is clear which of the two moved.
How does labor cost inflation flow through a unit-economics model?
Directly and quickly, because labor is a large, recurring, largely variable cost in a service format and it is difficult to defer. The offsetting levers are pricing, productivity per hour and menu or format changes, each of which acts with a lag and each of which has limits. The relevant question is not the size of the wage increase but how much of it the business has historically recovered and how long recovery took.
References
Disclaimer
This article is for educational purposes only and does not constitute investment advice, a recommendation, an offer, or a solicitation to buy or sell any security. This page is a research brief, not a completed analysis; it makes no valuation claim, price target, or judgment about whether Chipotle Mexican Grill, Inc. is a good or bad investment. Nothing on this page should be read as a signal to buy, sell, or hold.