
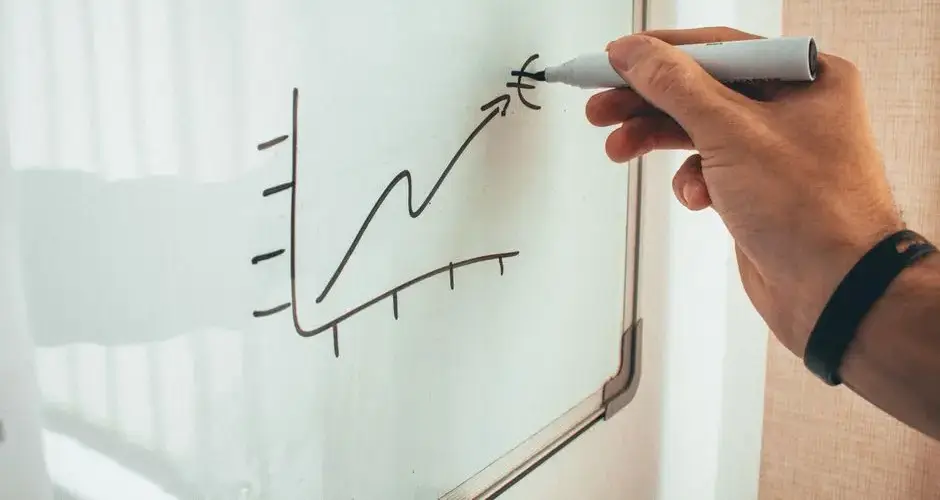
Direct Answer
A regression trend channel is built from a linear regression (least-squares best-fit) line drawn through closing prices over a chosen period, with two parallel lines offset above and below that line by a chosen number of standard deviations, or a fixed offset, forming a statistically-derived channel rather than one anchored to specific swing highs or lows. Price reaching an outer band is sometimes read as statistically stretched relative to the recent trend, though this describes recent price behavior rather than predicting what comes next.
What Is a Regression Trend Channel?
A regression trend channel is a charting tool built around a linear regression line -- the single straight line that best fits a set of closing prices over a chosen period, in the least-squares sense. Instead of an analyst choosing two or more swing points to connect by hand, the software fits the line mathematically across every closing price in the window, then draws two parallel bands above and below it, offset by either a chosen number of standard deviations or a fixed amount.
That construction is what separates it from a conventional trend channel. A hand-drawn channel is anchored to specific swing highs and lows the analyst selects, so its slope and width depend on which points were chosen. A regression channel is derived statistically from the whole period's closing prices, so it reflects the overall trend and dispersion of that data rather than any single pair of extreme prints.
This page walks through how the line and bands are constructed, a worked hypothetical example, how traders commonly read the outer bands, and where the statistical framing is easy to misread as more than a description of recent price behavior. It is educational content, not individualized investment advice.
Key Takeaways
- The center line is a least-squares best-fit line through closing prices over a chosen period -- not a line connecting specific swing highs or lows.
- The outer bands sit a chosen number of standard deviations, or a fixed offset, above and below the center line, forming a statistically-derived channel.
- Price reaching an outer band is sometimes read as statistically stretched relative to the recent trend -- that is a description of recent behavior, not a prediction of a reversal.
- The period and offset are chosen inputs, not fixed rules; changing either changes the channel's slope and width.
- A single outlier print has less influence on a regression line than on a hand-drawn channel anchored to that same point.
- The channel describes where price has recently traded relative to its own trend -- it does not by itself supply an entry trigger, a stop level, or a forecast.
How a Regression Trend Channel Is Built
The construction happens in two stages: fit the center line, then add the offset bands.
| Step | What happens | What it captures |
|---|---|---|
| Choose a period | Select the lookback window of closing prices the channel will be fit across (for example, the most recent 50 or 100 bars). | Sets which stretch of price history the line and bands describe. |
| Fit the regression line | A linear regression (least-squares best-fit) line is calculated through the closing prices in that window -- the line minimizing the sum of squared vertical distances from each close to the line. | A single straight line summarizing the dominant trend direction and slope across the whole period, rather than any two chosen points. |
| Measure dispersion | The standard deviation of closing prices from the regression line is calculated across the same period. | Quantifies how far, on average, closing prices have strayed from the fitted trend line. |
| Offset the outer bands | Two parallel lines are drawn above and below the regression line, offset by a chosen number of standard deviations (or a fixed amount instead of a standard-deviation multiple). | Forms the channel boundaries -- a statistically-derived width rather than one drawn to touch specific highs or lows. |
Because the line and bands are recalculated from the closing prices in the chosen period, both the slope of the center line and the width of the channel change as the period changes or as new bars roll into the window. A channel fit over the last 50 bars and a channel fit over the last 200 bars on the same chart can point in different directions and carry different widths, since each is describing a different stretch of history.
Worked Example: How It Looks and How to Read It
Hypothetical example -- for education only. Suppose a trader fits a regression trend channel over the most recent 60 daily closes of a stock. The regression line slopes gently upward, running from roughly $82 at the left edge of the window to roughly $94 at the current bar -- summarizing a mild uptrend across those 60 sessions. The standard deviation of closing prices from that line works out to roughly $3, and the trader sets the outer bands at two standard deviations, placing the upper band about $6 above the regression line and the lower band about $6 below it.

Midway through the window, price closes near the center line, around $88, sitting close to the statistical average trend. Later, a sharp rally pushes the close to $101 -- about $7 above the regression line's value at that point, putting the close outside the upper band. A trader watching the channel would note that this close sits further from the recent trend than roughly two standard deviations of typical closing-price dispersion covers, which some read as the move being statistically stretched relative to the trend captured by the line.
This is a hypothetical illustration with invented numbers, not a claim about how any particular security, period, or standard-deviation setting will behave. A real regression channel recalculates as new closes are added, the choice of period and offset materially changes where the bands sit, and a single example cannot establish how often outer-band touches are followed by any particular outcome.
How Traders Use It
The regression trend channel is primarily a visual summary of trend and dispersion, and the ways traders apply it stay tied to that description rather than to a certainty about what happens next.
- Trend context -- the slope of the center line offers a statistically fit view of the recent trend direction, which some traders compare against a hand-drawn trendline or a moving average as a cross-check.
- Stretch reads at the bands -- a close reaching or crossing an outer band is sometimes read as price being statistically stretched relative to the recent trend, a description some traders weigh alongside other evidence rather than treat as a standalone signal.
- Mean-reversion context inside a range -- in a market some traders judge to be range-bound, a touch of the outer band is sometimes treated as one input toward a possible reversion back toward the center line -- never a guarantee, and contested as a standalone approach even among traders who use it.
- Trend-continuation context -- in a market some traders judge to be strongly trending, repeated touches or brief pushes through an outer band can instead reflect the trend's strength, not an impending reversal -- a commonly cited caution against reading every outer-band touch the same way regardless of regime.
Because the reading of an outer-band touch depends heavily on what regime a trader believes the market is in, and that judgment is itself uncertain, the channel is more often paired with other trend, volume, or volatility evidence than used in isolation.
Limitations and Common Mistakes
- Treating an outer-band touch as a forecast. The channel describes where recent closing prices have traded relative to a fitted line -- it is not a prediction, and a stretched reading can persist or repeat, especially in a strong trend.
- Ignoring how much the period choice changes the channel. A shorter or longer lookback produces a different slope and different band placement on the same chart; a channel isn't a single fixed answer, it depends on the window chosen.
- Assuming the standard-deviation multiple is a fixed rule. Two standard deviations is a commonly cited starting point on many platforms, but it's a chosen parameter -- some traders use a different multiple or a fixed offset instead, and the right choice is contested and depends on the instrument.
- Using the channel alone as a complete trading plan. Like other statistically-derived tools, it doesn't supply a direction call by itself, an entry trigger, an invalidation level, or a position size -- those still need to come from a separately defined process.
- Extending the line far beyond the fitted period. The regression line and bands describe the chosen historical window; projecting them confidently far into future bars stretches the tool beyond what a backward-looking statistical fit can support.
The broader limitation is that a regression trend channel, like any tool built from historical closing prices, describes what has already happened. It can help organize a view of trend and recent dispersion, but it does not remove market risk, and readings at the outer bands are a description of recent behavior rather than a guarantee of what price does next.
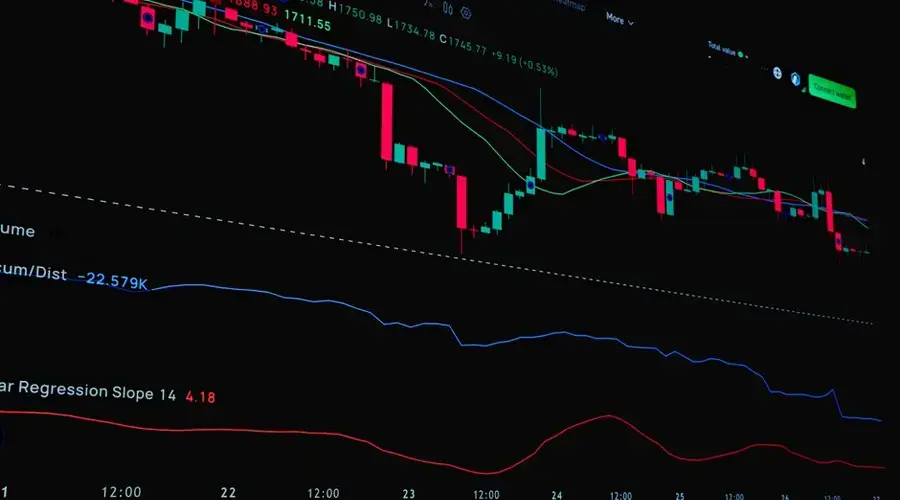
The Window You Fit Decides What the Channel Says
A regression channel removes the pivot-selection problem and replaces it with a window-selection problem. The line is fitted objectively to whatever data you include, and including a different range produces a different slope and a different set of boundaries. The objectivity is real and applies only after the arbitrary choice has been made.
The useful discipline is to choose the window for a reason external to the fit. A defined lookback, or the period since a specific event, is defensible. A window adjusted until the channel contains recent price neatly is the same subjectivity the tool was meant to remove, now hidden behind a calculation.
The mistake is reading the boundaries as support and resistance in the participant sense. They are statistical bands describing how far price has typically strayed from a fitted line, and there is no reason for other market participants to be acting at those prices. A touch is a description of dispersion, not an encounter with supply.
The fit also assumes a linear trend within the window. Price that curves, accelerates or changes regime is poorly described by a straight line, and the channel will report increasing deviation without any indication that the model rather than the price is at fault.
Regression Trend Channel FAQs
Is a regression trend channel the same as a normal trend channel?
No. A standard trend channel is drawn by hand between specific swing highs and swing lows. A regression trend channel is derived statistically -- the center line is a least-squares best-fit line through closing prices, and the outer bands are offset by a chosen number of standard deviations or a fixed amount, without reference to any particular swing point.
What does it mean when price touches the outer band of a regression channel?
It is sometimes read as price being statistically stretched relative to the recent trend captured by the regression line. That reading describes recent price behavior -- it is not a prediction that price will reverse, and touches can persist or repeat during a strong trend.
How many standard deviations should the outer bands use?
There is no single correct number. Two standard deviations is a commonly cited starting point on many platforms, but the offset is a chosen parameter, not a fixed rule, and the number that fits one instrument or lookback period may not fit another.
What period should a regression trend channel use?
The period is a chosen input, not a fixed setting. A shorter lookback fits recent price action more tightly and adjusts faster; a longer lookback smooths over more history and changes shape more slowly. The choice should match the timeframe and question being asked, and be tested rather than assumed.
Can a regression trend channel predict where price is going next?
No. The channel is a statistically-derived description of where closing prices have recently traded relative to a best-fit line -- it summarizes the past, not the future. Whether the current trend continues, stalls, or reverses is a separate question the channel does not answer on its own.
Why would a regression channel and a swing-point channel look different on the same chart?
A swing-point channel is anchored to specific highs and lows chosen by the analyst, so it can tilt sharply based on one or two extreme prints. A regression channel is fit across every closing price in the period using least squares, so a single outlier bar has less influence on the line's slope.
Why does a regression channel change every time a new bar arrives?
The channel is computed from a fixed lookback window, so each new bar enters the calculation and the oldest one leaves it. Both the centre line and the band width recalculate, which means the channel drawn today differs from the one drawn yesterday even without any dramatic price move. This is a structural difference from hand-drawn channels, which stay fixed until redrawn.
Does a regression channel imply that price will return to the centre line?
The construction fits a line minimising the distance to past prices, which describes where price has been rather than establishing any force pulling it back. Interpreting the centre line as an attractor imports a mean-reversion assumption the calculation does not contain. In a trending market, price can sit near an outer band for extended periods without the channel being wrong.
How does the lookback window choice change the conclusion?
A short window produces a channel that tracks recent price closely and reorients quickly, while a long one produces a slower channel that may not reflect the current trend at all. Because the two can point in opposite directions on the same chart, the window is effectively a choice about which trend you are analysing. Stating the window is part of stating the conclusion.