

Key Takeaways
- Trend followers accept missing the first leg of a move and expect to be wrong on many signals, in exchange for capturing the full length of moves that do continue.
- Common tools include higher-highs/higher-lows structure, moving-average crossovers, breakout levels, ADX for trend strength, trailing stops, and Donchian channels.
- No single tool is reliable in isolation, a moving-average crossover or breakout without a strength filter like ADX can whipsaw in a range-bound market.
- Trend systems often have lower win rates than expected because many entries fail to develop into a real trend, even though the winners can be large.
What Is Trend Following?
Trend following is a strategy that enters a position after a directional price move is already established, rather than trying to call the exact top or bottom of that move. The goal is to capture the middle portion of a sustained trend, missing the first leg of the move by design, in exchange for higher confidence that a real trend, rather than noise, is actually in place.
Trend followers generally accept that they will be wrong often, entering on signals that fail to develop into a real trend, in exchange for capturing the full length of the moves that do continue. This trade-off shows up directly in the win-rate discussion later in this guide.
Common Trend-Following Tools
- Higher highs and higher lows (or lower highs and lower lows for a downtrend), the basic price-structure definition of a trend that most other tools are built on top of.
- Moving-average alignment and crossovers, a faster moving average staying above a slower one, or crossing above it, is a common trend-confirmation and entry signal. The moving averages guide covers how SMAs and EMAs are calculated and how crossover signals are typically read, rather than repeating that here.
- Breakout levels, a price pushing above a prior swing high, or a defined lookback high such as the prior 20-day high, is a common trigger for entering in the direction of the move.
- ADX (Average Directional Index), measures the strength of a trend rather than its direction, and is often used to filter out weak, low-conviction moves before a signal is taken.
- Trailing stops, a stop that moves in the trade's favor as the position gains, locking in progressively more of an open profit without setting a fixed exit target in advance.
- Donchian channels, a band built from the highest high and lowest low over a set lookback period, commonly used to define both breakout entries and trailing exits.
None of these tools is reliable in isolation. A moving-average crossover in a market with no real directional strength can whipsaw repeatedly, which is why ADX or a similar strength filter is often layered on top of a crossover or breakout signal rather than trading the signal alone. A Donchian breakout without a strength filter behind it has the same weakness: the price crossed a level, but nothing in that fact alone says whether the move has the participation to continue.
A Worked Example: A Simple Trend Rule Set
Hypothetical example, for education only.
A simple trend-following rule set requires all of the following to be true before entering long: price above the 200-day moving average, the 50-day moving average above the 200-day moving average, and a breakout above the prior 20-day high. Applied to a hypothetical scenario: the 200-day moving average sits at $54,000, the 50-day moving average sits at $58,500, above the 200-day, confirming the uptrend, and the prior 20-day high is $64,500. Price breaks above that level and the entry fills at $64,800.
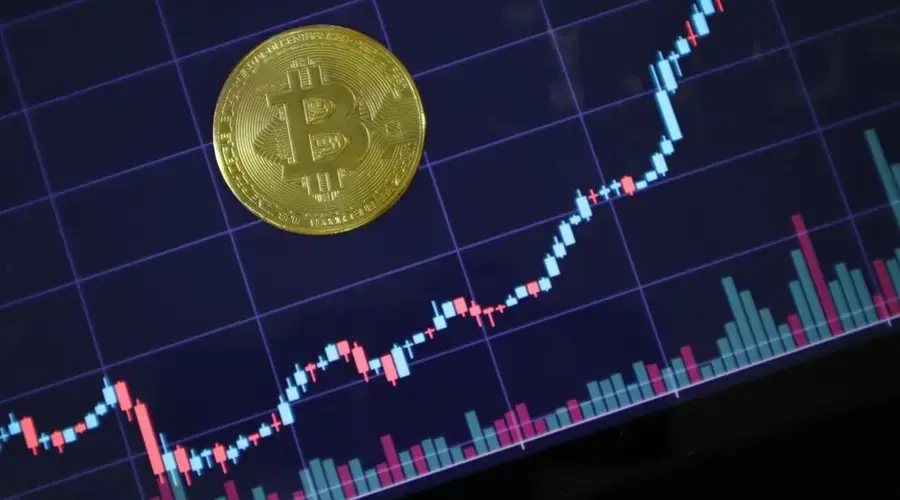
The stop is placed below the most recent swing low. That swing low sits at $61,900, and the rule set adds a buffer below it to avoid being stopped out by a brief undershoot, placing the stop at $61,500. Risk per unit is entry minus stop: $64,800 − $61,500 = $3,300.
Sizing the trade against account risk uses the same three-formula framework used throughout this site: maximum dollar risk = account value × risk percentage; position size = maximum dollar risk ÷ risk per unit. An account holding $50,000, risking 1% per trade, has a maximum dollar risk of $50,000 × 1% = $500. Position size is $500 ÷ $3,300 = 0.1515, rounded down to 0.15 units, so as not to exceed the risk budget. At that size, the actual dollar risk is 0.15 × $3,300 = $495, just under the $500 ceiling, and the position's entry value is 0.15 × $64,800 = $9,720.
The trailing-stop mechanism then takes over once the position is open: as price makes new highs, the stop moves up to lock in a growing share of the open profit, rather than exiting at one fixed target. The crypto position sizing guide and the position size calculator cover this sizing math in more depth, and the crypto stop-loss guide covers stop placement and trailing-stop mechanics beyond this single example.
Why Trend Systems Often Have Lower Win Rates Than Expected
A trend-following rule set is typically built to cut losing trades quickly, when a breakout or crossover fails to turn into a real trend, the predefined stop closes the position for a small, controlled loss, while letting winning trades run for as long as the trend continues, using a trailing stop rather than a fixed target. That combination tends to produce many small losses and a smaller number of large wins, which means the strategy can be net profitable even though most individual trades lose money. A trader who expects most trades to win, because that's the intuitive definition of "working," can misjudge a properly functioning trend system as broken simply because its win rate looks low on paper.
The tradeoff shows up most sharply in sideways, range-bound markets, where price repeatedly approaches a breakout or crossover level without following through in either direction. Each failed attempt can trigger an entry, only to reverse and hit the stop shortly after, a pattern known as a whipsaw. A market that spends a long stretch chopping sideways can produce a string of these small losses with no offsetting trend to ride, which is the main reason profitability depends so heavily on letting the occasional large winner run far larger than the typical loss.
A simplified illustration makes the shape of this concrete. Suppose a trend system takes ten trades in a choppy quarter: seven are stopped out for a loss of 1% of account risk each, for a combined loss of 7%, while three continue into real trends and each returns 4% of account risk, for a combined gain of 12%. The system won on only three of ten trades, a 30% win rate, yet still finished the quarter up 5% overall (12% gained minus 7% lost), because the average winner was several times larger than the average loser. A trader judging the system by win rate alone, without accounting for the size of wins versus losses, would see "30%" and assume the strategy was failing.
What Is Momentum Trading?
Momentum trading focuses on the strength or acceleration of a price move rather than its established direction. Common inputs include the rate of change over a recent lookback window, relative strength against a benchmark or peer set, expanding trading volume alongside the price move, and price reaching new highs. Where trend following generally waits for a direction to already be in place, higher highs and higher lows, moving averages aligned, momentum trading can trigger on a move that is accelerating quickly, even before that structure is fully confirmed.

That difference in timing is the core distinction between the two approaches: trend following asks whether a direction is established; momentum trading asks how strong and fast the current move is. A market can show strong momentum without yet qualifying as an established trend by a trend-following rule set, and a slow, grinding trend can persist with relatively weak momentum readings throughout.
Relative strength and rate-of-change readings are usually built from the same underlying price data used elsewhere on this site, the RSI guide covers how a relative-strength oscillator is calculated and interpreted, and that same mechanical building block is repurposed here to rank or filter assets by how strongly they're moving rather than to spot overbought or oversold conditions on a single chart.
The Late-Entry Danger in Momentum Trading
Because momentum trading can trigger earlier in a move, it also carries a specific risk that trend following is less exposed to: buying after the easiest part of the gain has already happened, right before a pullback or reversal. A move that has already extended sharply above its recent base or moving average can look most exciting exactly when it's statistically most likely to pause or reverse, which is precisely when a trader driven by excitement rather than a rule is most likely to buy.
Four elements are typically needed to manage that risk in a momentum trade plan:
- A defined entry trigger. A specific rate-of-change threshold, volume expansion level, or relative-strength reading, decided in advance, not judged in the moment.
- A maximum acceptable extension. A limit on how far price can already have moved above a recent base or moving average before a new entry is skipped rather than chased.
- A stop-loss. A predefined exit if the anticipated continuation doesn't materialize, since momentum can reverse as quickly as it built.
- A partial-profit plan. Taking some profit as a fast move extends, rather than holding the entire position for an uncertain further extension.
Without those four elements decided ahead of time, momentum trading can turn into chasing whatever has already moved the most, which is a description of buying high with no defined plan, not a strategy.
Common Mistakes in Trend and Momentum Trading
- Abandoning the system after a losing streak. Given the win-rate math above, several consecutive losses can be a normal part of a working trend system rather than a sign that it has stopped working.
- Setting a fixed profit target on a trend trade. A fixed target caps the exact thing a trend-following approach is designed to capture, the length of a large, sustained move, in favor of a smaller, more certain gain.
- Chasing a move that has already extended far past its moving average or recent base. The late-entry risk described above, taken without a defined maximum-extension rule.
- Widening a stop after price moves against the position. Moving a stop further away to avoid being "wrong" turns a sized, defined-risk trade into an open-ended one.
- Adding a trend or momentum filter after seeing how a specific trade turned out. A rule chosen because it would have worked on one already-known trade is not the same as a rule tested across many different market conditions.
- Treating every moving-average crossover as equally significant. A crossover in a strong, established trend and a crossover in a directionless, choppy market are not the same signal, even though they look identical on the chart in isolation.
Building a Trend or Momentum Trade Plan
Trend context
- Is price above or below the relevant longer-term moving average, and are the shorter and longer moving averages aligned in the same direction?
- Does a trend-strength filter such as ADX confirm real directional strength, or is the market chopping sideways?
Trigger
- What specific breakout level, crossover, or momentum threshold triggers this entry?
- For a momentum entry specifically: has price already extended beyond the maximum acceptable extension defined in advance?
Risk
- Where does the stop sit, and what recent structure, a swing low, a moving average, a channel boundary, does it sit below?
- What is the maximum dollar risk on this trade as a percentage of the account, using the account-risk formula shown in the worked example above?
Management
- Is there a trailing-stop rule for letting a winning trade run, rather than a single fixed profit target?
- Is there a partial-profit plan for a momentum trade that extends quickly?
- What would count as the trend or momentum thesis failing, distinct from ordinary short-term noise against the position?
Trend Following vs. Momentum Trading
| Factor | Trend Following | Momentum Trading |
|---|---|---|
| Entry timing | After a direction is already established | Can trigger earlier, on accelerating strength |
| Holding period | As long as the trend continues, often weeks or longer | Typically shorter, days to weeks, tied to the move's strength |
| Typical risk | Whipsaws in sideways markets; a low win rate that depends on large winners | Late entries near an exhaustion point; sharp reversals after a fast extension |
The two approaches are frequently combined rather than treated as an either-or choice: a trend-following filter can confirm the broader direction, while a momentum trigger times the specific entry within that established trend.

Accepting the Loss Rate That Trend Following Requires
Trend following is a method whose ordinary experience is being wrong more often than right. Most signals fail, and the profitability of the approach rests on a minority of trades running far enough to cover the rest. Anyone who cannot tolerate a long run of small losses will abandon the method during exactly the stretch it needs to be maintained.
The practical consequence is that exits matter more than entries. Cutting a losing signal quickly and giving a working one room to extend is the whole mechanism, and the instinct runs the other way: taking a modest gain feels prudent while holding a small loss feels patient. Reversing that instinct is the discipline.
The mistake specific to this market is confusing trend with momentum in the strong-move sense. A sharp vertical advance is not the same as a sustained trend, and methods designed to ride multi-week directional moves behave poorly when applied to spikes that reverse within days.
Trend approaches also perform worst in ranging conditions, which cannot be identified until afterwards. Filters intended to detect a range reduce the number of false signals and also remove some of the trades that would have paid for them, so there is no setting that solves the problem rather than trading one cost for another.
Trend-Following and Momentum FAQs
What is trend following in crypto trading?
Trend following is a strategy that enters a position after a directional price move is already established, aiming to capture the middle portion of a sustained trend rather than predicting exactly where it will start or end. It typically relies on tools like moving-average alignment, breakout levels, and trailing stops rather than forecasting a top or bottom in advance.
What's the difference between trend following and momentum trading?
Trend following focuses on the established direction of a price move and aims to stay with it until the trend clearly changes. Momentum trading focuses on the strength or acceleration of a move, how fast price, volume, or relative performance are expanding, and can trigger an entry earlier in a move, before a trend is as clearly established.
Why do trend-following strategies have low win rates?
Trend-following rules are typically designed to cut losing trades quickly, when a breakout or crossover fails to develop into a sustained move, while letting winning trades run as long as the trend continues. That combination produces frequent small losses and occasional large gains, so the strategy can be profitable overall even when most individual trades lose money.
What causes whipsaws in trend trading?
A whipsaw happens when price triggers a trend-following entry signal, a breakout or a moving-average crossover, for example, and then reverses shortly afterward, stopping the trade out for a loss. Whipsaws are most common in sideways or choppy markets, where price repeatedly tests a level without following through in either direction.
How do you avoid buying a momentum move too late?
A defined entry trigger, a maximum acceptable extension above a recent base or moving average, and a firm decision to skip a trade once price has already moved too far are the main safeguards. Momentum traders who chase a move without those limits tend to buy after the easiest gains have already been made, right before a pullback or reversal.
Do trend-following and momentum strategies work in sideways markets?
Generally, no, both tend to underperform in sideways, range-bound conditions, since there is no sustained directional move to capture and breakout or crossover signals are more likely to fail and reverse. Traders using these strategies often reduce position size, widen filters, or stand aside entirely when a market lacks a clear trend.
How long does a trend-following strategy typically go without a winning trade?
Extended losing streaks are structural rather than exceptional, because these systems accept many small losses in exchange for a few large gains. A backtest reveals the longest historical run of losses the rules produced, and live trading should be expected to exceed it eventually. Knowing that figure before starting is what makes a drawdown a known cost rather than evidence the system has stopped working.
Do moving average crossovers work as a standalone trend signal?
Crossovers identify that a trend has already been underway, which is both their purpose and their limitation: the signal arrives after a portion of the move and produces frequent false starts in sideways conditions. Used alone the result is heavily dependent on the specific periods chosen, which is a warning sign in itself. Most durable implementations add a filter for whether the market is trending at all before acting on a crossover.
What is the difference between absolute momentum and relative momentum?
Absolute momentum compares an asset against its own past, asking whether it has risen over some lookback window, and produces a hold-or-exit decision. Relative momentum compares assets against each other and produces a ranking, so capital rotates toward whichever is strongest. A relative approach can stay fully invested in the best of a falling set, which is why the two are often combined rather than used alone.
Related Guides
- Crypto trading strategies: the full overview of this strategy cluster.
- DCA and position trading: a longer-horizon, discretionary-entry approach closely related to trend following.
- Crypto swing trading: a shorter-holding-period strategy that also depends on riding a directional move.
- Range trading and grid strategies: the opposite case, built for markets with no clear trend.
- Day trading vs. scalping: much shorter holding periods than trend following or momentum trading.
- Backtesting a crypto strategy: testing whether a trend or momentum rule set actually held up historically.
- Crypto position sizing and the position size calculator: the sizing math used in the worked example above.
- Crypto stop-loss orders: stop placement and trailing-stop mechanics in more depth.
- Moving averages: SMA vs. EMA: the indicator math behind trend-alignment signals.
- Overtrading: the psychology behind chasing a momentum move that's already extended.