
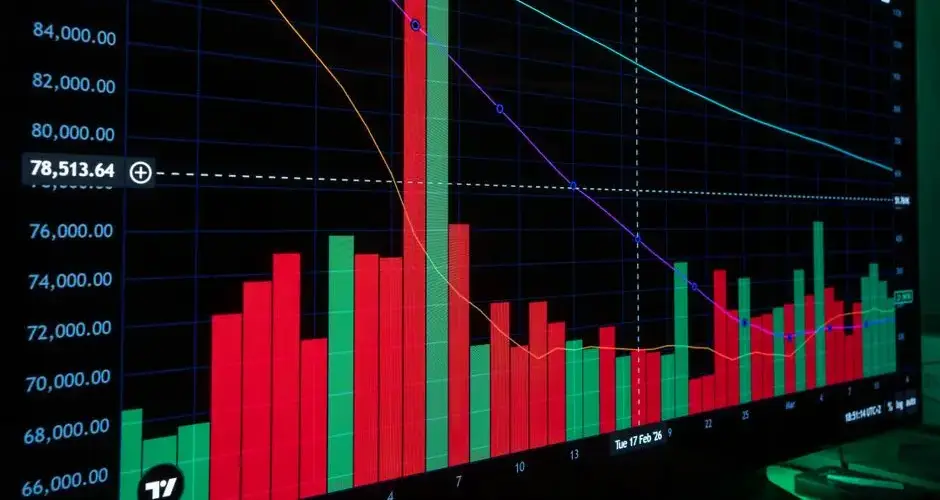
Direct Answer
Historical volatility (HV) measures how much an asset's price has actually fluctuated over a specific past period, calculated as the annualized standard deviation of its daily log returns. It is a purely backward-looking statistic drawn from realized price data, unlike implied volatility, it makes no claim about how much the asset will move going forward. Traders use it to gauge an asset's recent behavior and to compare against option-implied expectations.
Key Takeaways
- Historical volatility (also called realized volatility) is the annualized standard deviation of an asset's past daily log returns.
- It is entirely backward-looking, calculated from price data that has already happened, not a forecast.
- Common lookback windows include 10, 20, 30, and 60 trading days; the choice changes the reading.
- Annualization typically multiplies the daily standard deviation by the square root of 252 trading days.
- Higher HV means larger past price swings in either direction, not a directional bias.
- HV is frequently compared against implied volatility (IV) to see whether options are pricing in more or less movement than has recently occurred.
- Volatility tends to cluster, periods of high HV are often followed by more high-volatility periods, and calm periods by more calm periods.
- HV can be calculated on any asset with a price history: stocks, ETFs, indexes, and cryptocurrencies alike.
What Is Historical Volatility?
Historical volatility describes the dispersion of an asset's returns over a defined lookback window, expressed as a single annualized percentage. A stock that has recently moved 1% or less on most days will show a low HV reading; a stock that has swung several percent per day will show a high one. Because the calculation only uses data that has already occurred, HV is sometimes called "realized volatility" to distinguish it from implied volatility, which is derived from current options prices and reflects a forward-looking expectation.
HV says nothing about direction. An asset climbing steadily higher and an asset chopping sideways in a wide range can post similar historical volatility figures if the magnitude of daily moves is comparable, the statistic captures the size of price changes, not their sign or trend.
How Historical Volatility Is Calculated
The standard calculation follows three steps:
- Compute daily log returns. For each trading day in the lookback window, calculate
ln(closeToday / closeYesterday). - Take the standard deviation of those returns. This produces a daily volatility figure.
- Annualize. Multiply the daily standard deviation by the square root of the number of trading periods in a year, commonly 252 for daily stock data (365 is sometimes used for assets like crypto that trade every day of the year).
As a formula:
HV = σ(daily log returns) × √252
The result is expressed as a percentage, for example, an HV reading of 25% suggests the asset's annualized standard deviation of returns has been around 25% over the chosen lookback window.
A Hypothetical Example
Consider a hypothetical scenario using illustrative, non-market data. Suppose a hypothetical stock closes at the following prices over six trading days: $100.00, $101.20, $99.80, $100.90, $102.10, and $101.50. Calculating the daily log returns between consecutive closes and then taking their standard deviation might produce a daily standard deviation of roughly 0.9%. Annualizing that figure by multiplying by the square root of 252 (about 15.87) gives a historical volatility reading of approximately 14%.
If, over a different hypothetical 20-day window, the same stock's daily standard deviation of returns rose to 1.8%, its annualized HV would climb to roughly 29%, illustrating how HV rises and falls as the lookback window captures calmer or choppier stretches of price action. These figures are illustrative only and do not represent any real security.
Why Historical Volatility Matters
Traders use historical volatility in several practical ways. Options traders frequently compare HV to implied volatility: when IV sits well above recent HV, options may be pricing in more movement than the asset has actually shown, and when IV sits below HV, the reverse may be true, though neither comparison alone justifies a trade. Position-sizing frameworks often scale trade size inversely to volatility, so a higher HV reading can translate into a smaller position for the same dollar risk. Volatility is also a core input to many risk models, stop-placement methods, and portfolio-level risk budgeting approaches, since it offers a standardized way to compare how much different assets have historically moved.
Limitations and Common Mistakes
- Treating HV as a forecast. Historical volatility describes what already happened; it does not predict future price movement, which can change abruptly regardless of the recent past.
- Ignoring lookback-window sensitivity. A 10-day HV and a 60-day HV on the same asset can differ meaningfully, the chosen window materially changes the reading, so a single HV number without context can mislead.
- Confusing HV with implied volatility. HV and IV answer different questions (past vs. expected future movement) and can diverge significantly, especially around known catalysts.
- Overreacting to a single volatility spike. One outsized price move can distort short-lookback HV substantially; traders often check multiple windows before drawing conclusions.
- Assuming high volatility equals bad and low volatility equals good. Volatility is a measure of magnitude, not quality, both rising and falling assets can be volatile, and low volatility does not itself indicate safety.
- Mixing annualization conventions. Comparing an HV calculated with a 252-day annualization factor against one calculated with 365 days (common in crypto) without adjusting produces an apples-to-oranges comparison.
An HV Figure Without Its Window Says Little
Historical volatility is not a property of an asset. It is a property of an asset over a stated window, and a 10-day and a 60-day reading on the same stock can disagree enough to support opposite descriptions of the same market. Any time you write down or receive an HV number, the lookback belongs next to it, and so does the annualisation convention used to produce it.
That last point causes more confusion than it should. Daily dispersion is typically scaled by the square root of the trading-day count, which differs between markets that close and markets that do not. Compare a figure annualised one way against a figure annualised another and the gap you find is an artefact of arithmetic rather than a difference in behaviour.
The interpretive mistake is treating the number as a forecast. HV records movement that has already occurred, and a market can change character abruptly without any warning appearing in a backward-looking statistic first. It is a description, useful for knowing what kind of market you have been dealing with, and for setting a reference against what options are currently pricing in.
One practical habit reduces most errors here. Check more than one window before drawing a conclusion, because a single outsized session can dominate a short lookback and produce a reading that looks like a regime change when it is really one day. And remember the measure is directionless: a stock that has rallied hard and a stock that has collapsed can post the same number.
Frequently Asked Questions
What is historical volatility?
Historical volatility (HV) is a statistical measure of how much an asset's price has actually fluctuated over a specific past period, typically expressed as an annualized standard deviation of daily log returns. It describes realized price behavior, not a forecast of future price behavior.
How is historical volatility calculated?
Historical volatility is calculated by taking the daily log returns of an asset over a chosen lookback window, computing their standard deviation, and then annualizing that figure by multiplying by the square root of the number of trading periods in a year (commonly 252 for daily stock data).
What is the difference between historical volatility and implied volatility?
Historical volatility is backward-looking and calculated directly from past price data. Implied volatility is forward-looking and derived from current options prices, reflecting the market's collective expectation of future volatility. The two often diverge, and comparing them is a common options-analysis technique.
What lookback period is typically used for historical volatility?
There is no single standard lookback period. Traders commonly use windows such as 10, 20, 30, or 60 trading days depending on the timeframe they are analyzing, and comparing HV across multiple windows can reveal whether volatility is currently rising or falling.
Does high historical volatility mean an asset is risky?
High historical volatility indicates that an asset's price has moved by a larger magnitude in the past, which can correspond to greater uncertainty or risk, but it does not indicate direction. An asset can have high historical volatility while trending steadily upward, and volatility levels can shift going forward even when the historical figure stays the same.
Does historical volatility use log returns or simple returns?
Log returns are the convention, for two reasons. They are additive across periods, which makes the square-root-of-time scaling behave consistently, and they treat a rise and the equivalent fall symmetrically, which simple percentage returns do not. The difference between the two is negligible for small moves and grows with the size of the return, so it matters most in exactly the periods being measured.
How do weekends and holidays affect the calculation?
A close-to-close return spanning a weekend covers roughly three calendar days while a midweek one covers about one, yet both enter the calculation as a single observation. Standard practice ignores this and counts trading days only, which is a simplification rather than a correction. It matters more for markets with long closures and for periods containing extended holiday breaks.
What is a volatility cone?
A chart showing the historical range of volatility readings at several different lookback lengths at once, usually as a set of percentile bands. It answers a question a single reading cannot: whether the current 30-day figure is unusual relative to past 30-day figures, and how that compares to the 10-day and 90-day picture. It puts a reading in context rather than reporting it in isolation.
Can historical volatility be computed on something other than a price?
Yes. The formula only needs a series of returns, so it applies to a ratio between two instruments, to an index level, to a spread expressed proportionally, or to any other series that can be differenced. What does not carry over is the interpretation: a volatility figure for a ratio describes how much the relationship moves, which is a different quantity from the volatility of either leg.
References
Disclaimer
This page is for educational purposes only and does not constitute investment, financial, or trading advice. Historical volatility reflects past price behavior and does not guarantee or predict future results. Any chart, formula example, or price figure on this page uses illustrative, hypothetical data, not live market data. Swoopr Investment is not a licensed investment advisor; consult a qualified professional before making investment decisions.