
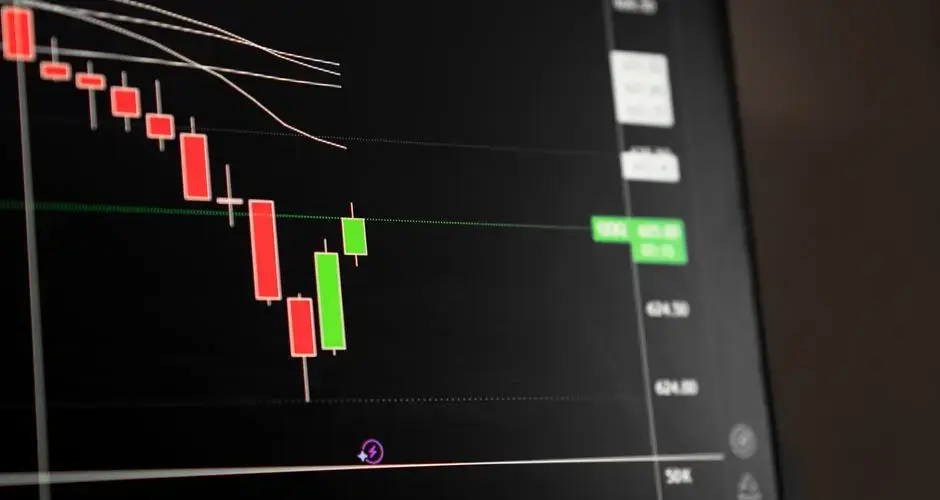
Direct Answer
Parabolic SAR (Stop and Reverse) is a trend-following indicator, developed by J. Welles Wilder, that plots a series of dots above or below price. Dots below price mark an uptrend and dots above price mark a downtrend; when price crosses the dots, the indicator flips sides and the dot resets, flagging a potential trend reversal. It is commonly used both to read trend direction and as a trailing stop-loss level.
Key Takeaways
- Parabolic SAR plots dots that trail price, below price in an uptrend, above price in a downtrend.
- A "flip" happens when price crosses the current dot, reversing the indicator's trend read.
- The formula relies on an acceleration factor (AF) that starts at 0.02 and steps up by 0.02 (max 0.20) each time a new extreme point is set.
- As AF rises, the dot accelerates toward price, tightening the implied stop as a trend matures.
- Developed by J. Welles Wilder, the same technician behind RSI and ATR.
- Works best in sustained trends; tends to whipsaw and generate false flips in sideways, range-bound markets.
- Widely used as a trailing-stop reference for an open position rather than as a standalone entry signal.
- Best combined with a trend-strength filter (e.g., ADX) rather than traded in isolation.
What Is Parabolic SAR?
Parabolic SAR stands for "Stop and Reverse." It is a price-based overlay indicator, plotted directly on a price chart as a series of dots, designed to identify the direction of a trend and highlight points where that trend may be reversing. When the dots sit below the candles, the indicator is reading an uptrend; when the dots sit above the candles. It is reading a downtrend. The name reflects its original purpose: Wilder designed it as a mechanical stop-loss level that "stops and reverses" a position when price trades through it.
Unlike a simple moving average, the SAR line is not smooth, it curves and accelerates because its underlying acceleration factor increases every time price sets a new extreme in the direction of the current trend. This gives the indicator its "parabolic" shape: the dots trail loosely behind price early in a trend and tighten in toward price as the trend extends.
The Parabolic SAR Formula
Parabolic SAR is calculated iteratively, one period at a time, using three inputs: the prior SAR value, an acceleration factor (AF), and the extreme point (EP), the highest high (in an uptrend) or lowest low (in a downtrend) reached since the current trend began. The core formula is:
SAR(next) = SAR(current) + AF × (EP − SAR(current))
- AF (acceleration factor) starts at 0.02 and increases by 0.02 every time a new EP is recorded, up to a maximum of 0.20 (these are Wilder's original default settings).
- EP (extreme point) is updated to the new high in an uptrend, or the new low in a downtrend, whenever price makes a fresh extreme.
- When price crosses the current SAR value, the trend flips: the new SAR resets to the prior EP, the AF resets to 0.02, and a new EP tracking begins in the opposite direction.
Because AF only grows and never shrinks within a single trend leg, the SAR dots accelerate toward price the longer a trend persists, which is also why the indicator can look like it's "catching up" sharply just before a reversal.
Worked Example (Hypothetical)
Consider a hypothetical stock in an established uptrend. Assume the current SAR sits at $48.00, the extreme point (the highest high reached so far in this uptrend) is $52.00, and AF has stepped up to 0.06 after three new highs. Applying the formula:
SAR(next) = $48.00 + 0.06 × ($52.00 − $48.00) = $48.00 + 0.06 × $4.00 = $48.00 + $0.24 = $48.24
If price then prints a fresh high of $52.50 on the next bar, EP updates to $52.50 and AF steps up again to 0.08. If instead price falls through $48.24, the uptrend calculation ends: SAR flips to sit above price at the prior EP of $52.00 (or $52.50, depending on when the cross occurred), AF resets to 0.02, and the indicator begins tracking a new downtrend. All figures here are illustrative only and do not reflect any real security's price history.
Why Parabolic SAR Matters
Traders use Parabolic SAR for two related purposes: reading trend direction at a glance, and managing risk on an open position. Because the dot sits on one side of price for the duration of a trend and only flips on a genuine crossover, it gives a simple visual cue, dots below price, stay long-biased; dots above price, stay short-biased, without needing to interpret a lagging moving-average crossover or an oscillator's numeric reading.
As a trailing stop, the appeal is that SAR tightens automatically as a trend extends. A trader holding a long position can use the current SAR dot as a stop-loss level that walks up with price, locking in more of the gain the longer the trend runs, rather than relying on a fixed percentage or dollar stop that never adjusts.
Limitations and Common Mistakes
- Whipsaws in range-bound markets. Parabolic SAR is a trend-following tool; in a sideways or choppy market it flips sides repeatedly, generating false signals in quick succession.
- Treating every flip as a trade signal. A single crossover can be noise rather than a genuine trend change, especially on shorter timeframes or during low-volatility periods.
- Ignoring trend strength. SAR says nothing about how strong a trend is, only its current direction, many traders pair it with a trend-strength gauge such as ADX before acting on a flip.
- Using default settings on every asset and timeframe. Wilder's 0.02/0.02/0.20 defaults were designed for the markets and timeframes he traded; some traders adjust the step or maximum AF for faster- or slower-moving instruments, changing how sensitive the flips are.
- Relying on it as a sole exit rule. Because SAR accelerates toward price late in a trend, it can trigger an exit on a routine pullback rather than a genuine reversal, particularly in a strong, mature trend.
The Dot Tightens as the Trend Gets Older
The acceleration factor is the part of Parabolic SAR worth understanding before using it, because it decides the indicator behaviour more than the trend does. Each new extreme steps the factor up, and a higher factor pulls the dot toward price faster. The trailing stop therefore tightens the longer a trend runs, which means the tool becomes most likely to take you out precisely when a move has been going your way for a while.
Whether that is a feature depends entirely on what you are trying to do. As a mechanical way to lock in an ageing trend, it does its job. As a sole exit rule, it can end a position on an ordinary pullback that a fixed or volatility-based stop would have absorbed, and that outcome is a property of the maths rather than a misreading of the chart.
The reversal side invites the more common mistake. Every flip looks like a signal, and in sideways price action the dots jump from one side to the other in quick succession, each flip as confident-looking as the last. SAR carries no measure of trend strength, only current direction, which is why it is frequently paired with a strength gauge before a flip is treated as anything to act on.
The 0.02 step and 0.20 maximum are Wilder defaults, chosen for the instruments and timeframes he traded. Changing them changes how quickly the stop closes in, and that is a risk decision as much as an indicator setting. Make it deliberately, and know which direction you moved it.
Frequently Asked Questions
What is Parabolic SAR?
Parabolic SAR (Stop and Reverse) is a trend-following indicator, developed by J. Welles Wilder, that plots a series of dots above or below price. Dots below price signal an uptrend; dots above price signal a downtrend. When price crosses the dots, the indicator flips sides, marking a potential reversal.
How is Parabolic SAR calculated?
Each new SAR value equals the prior SAR plus an acceleration factor (AF) multiplied by the difference between the extreme point (EP, the highest high or lowest low reached during the current trend) and the prior SAR. AF starts at 0.02 and increases by 0.02 each time a new extreme point is set, up to a maximum of 0.20.
What does it mean when Parabolic SAR flips sides?
A flip occurs when price crosses the current SAR dot. The trend direction reverses in the indicator's calculation, the SAR resets to the prior extreme point, and the acceleration factor resets to its starting value. Traders often read a flip as a signal that the prevailing trend may be ending.
Does Parabolic SAR work well in sideways markets?
No. Parabolic SAR is designed for trending conditions and tends to whipsaw, flipping direction repeatedly and generating false signals, when a market is ranging or moving sideways without a clear trend.
Is Parabolic SAR used as a trailing stop?
Yes. Many traders use the SAR dot level as a trailing stop-loss reference for an existing position, since the dot moves closer to price as the acceleration factor increases, tightening the stop as a trend matures.
What is the acceleration factor?
The term that determines how quickly the stop closes on price. Wilder original specification starts it at 0.02, increases it by 0.02 each time a new extreme is reached in the direction of the trend, and caps it at 0.20. The result is that the dot tightens faster the longer a trend persists and the more new extremes it makes, which is the behaviour the parabolic shape describes.
Does Parabolic SAR depend on where the calculation started?
Yes, because the formula is recursive: each value depends on the previous one, on the extreme point reached so far, and on the current acceleration factor, all of which carry forward from the start of the series. Two charts of the same instrument loaded with different amounts of history can therefore show the dots at different levels, and the difference persists until a flip resets the state.
Can the SAR value fall inside the current bar range?
The specification prevents it, by restricting the stop so that it cannot be placed within the range of the current or previous bar. Without that rule the stop could be triggered on the same bar it was calculated for, which would make it meaningless. The adjustment is a documented part of the method rather than an implementation detail, and implementations that omit it produce different flips.
Is Parabolic SAR always in the market?
By construction, yes. The dot is either above price or below it, and when price crosses it the system flips to the opposite side rather than standing aside. There is no flat state in the original specification. That makes it a stop and reverse mechanism rather than a stop, and it is the main reason it performs poorly in conditions with no sustained direction.
References
Disclaimer
This page is for educational purposes only and does not constitute investment, financial, or trading advice. Technical indicators like Parabolic SAR reflect historical price behavior and do not guarantee future results; any chart or example on this page uses illustrative, hypothetical data, not live market data. Swoopr Investment is not a licensed investment advisor; consult a qualified professional before making investment decisions.