
Direct Answer
The True Strength Index (TSI) is a momentum oscillator developed by William Blau that applies two successive rounds of exponential smoothing to price momentum. The goal is a smoother, less noisy oscillator than a single-smoothed momentum indicator, while still responding to genuine trend changes.
Key Takeaways
- TSI applies two layers of exponential smoothing to price momentum, aiming to filter out short-term noise more effectively than a single-smoothed momentum reading.
- TSI oscillates around a zero line: readings above zero reflect net upward momentum, readings below zero reflect net downward momentum.
- A signal line, typically an EMA of TSI itself, is commonly plotted alongside TSI, and crossovers between the two are read similarly to a MACD signal-line crossover.
- The indicator was developed by William Blau, who built several momentum tools around the double-smoothing technique to balance noise reduction against responsiveness.
- Extreme TSI readings are sometimes used for overbought/oversold context, but unlike RSI or Stochastics, TSI has no universally fixed bounded range or standard threshold levels.
- Double smoothing reduces noise at the cost of added lag, TSI reacts to trend changes more slowly than a single-smoothed momentum line.
What Is the True Strength Index (TSI)?
The True Strength Index (TSI) is a momentum oscillator developed by William Blau that applies two successive rounds of exponential smoothing to price momentum. The goal is a smoother, less noisy oscillator than a single-smoothed momentum indicator, while still responding to genuine trend changes. TSI oscillates around a zero line and is commonly paired with a signal line for crossover-based reads, similar to MACD.
How TSI Is Built
TSI starts from simple price momentum, the change in price from one bar to the next. That raw momentum series is noisy on its own, so Blau's approach smooths it twice: first with an exponential moving average (EMA) over a longer lookback (often 25 periods in common implementations), then with a second EMA over a shorter lookback (often 13 periods) applied to the output of the first smoothing pass. The same double-smoothing is applied to the absolute value of momentum, which captures total price movement regardless of direction.
TSI is then expressed as a ratio: the double-smoothed momentum divided by the double-smoothed absolute momentum, scaled to a percentage. Dividing by absolute momentum normalizes the reading against how much the price has been moving overall, which is part of why TSI is described as measuring the "true strength" of a directional move rather than raw price change alone.
How to Read TSI
The zero line
Because TSI is built from the ratio of directional to total momentum, it oscillates around zero. A reading above zero means double-smoothed upward momentum has outweighed downward momentum over the lookback period; a reading below zero means the reverse. Traders sometimes use a zero-line cross as a broad, slower-moving trend-direction signal.
Signal-line crossovers
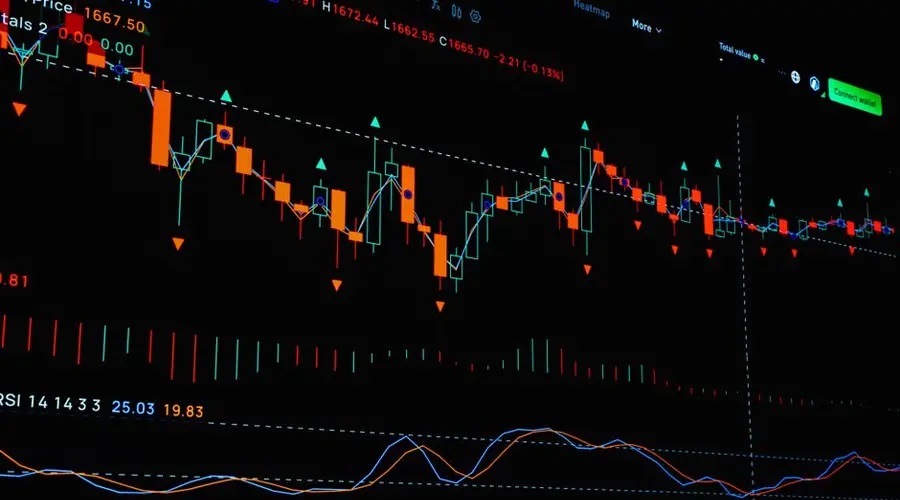
A signal line, usually a short EMA of the TSI line itself, is commonly plotted alongside TSI. When TSI crosses above the signal line, that's read as tightening upward momentum; when it crosses below, tightening downward momentum. This mirrors how a MACD line and its signal line are read together, though the underlying construction of TSI and MACD differs.
Overbought and oversold context
Because TSI isn't bounded to a fixed range the way RSI (0-100) or Stochastics are, there's no universally standardized overbought/oversold threshold. Some traders watch for TSI reaching unusually high or low readings relative to its own recent history on a given security as a caution sign, rather than applying a fixed numeric level across every market.
Why Double Smoothing Matters
A single-smoothed momentum line reacts quickly to price changes, but that speed comes with a tradeoff: it also reacts to short-term noise that has nothing to do with the underlying trend. TSI's second smoothing pass is designed to dampen that noise further, producing a steadier line. The tradeoff runs the other way too, each additional smoothing pass adds lag, so TSI turns later than a single-smoothed momentum reading would after a genuine trend change. Traders weighing TSI against a simpler momentum indicator are effectively trading some responsiveness for a cleaner signal.
Limitations and Common Mistakes
- Treating TSI as a standalone trigger, like most momentum oscillators, TSI can whipsaw in choppy or range-bound markets and works best combined with trend context or other confirming signals.
- Ignoring the lag from double smoothing, TSI's zero-line and signal-line crosses arrive later than a single-smoothed momentum line's, which matters for traders prioritizing early entries.
- Applying a fixed overbought/oversold number across every security, because TSI isn't bounded like RSI, treating an arbitrary threshold as a universal rule ignores that "extreme" varies by instrument and volatility regime.
- Confusing TSI with MACD mechanically, both are zero-line, signal-line-crossover oscillators, but they're built from different inputs (double-smoothed momentum vs. the difference of two EMAs of price), so their exact readings and turning points won't match.
The Price You Pay for a Smoother Line
Every decision about TSI comes back to one trade. The second smoothing pass buys a calmer line with fewer false turns, and it pays for that with lag. If your holding period is measured in days or weeks, a signal arriving a few bars later is an acceptable cost for cutting the noise. If you are trying to be early, TSI is structurally the wrong instrument, and no parameter choice removes the delay that double smoothing builds in.

The mistake TSI invites is imported from RSI: picking a fixed number and calling it overbought. TSI is not bounded the way RSI is, so there is no level that carries the same meaning across a low-volatility index and a high-volatility single stock. If you want extreme readings to mean something, calibrate them against that instrument own recent range rather than against a threshold borrowed from another indicator.
A second, subtler error is expecting TSI and MACD to agree. Both oscillate around zero and both use a signal-line crossover, which makes them look like variants of one another. They are not: MACD measures the gap between two EMAs of price, while TSI double-smooths bar-to-bar momentum. Their turning points will differ, and treating a disagreement as one indicator being wrong misreads what each is measuring.
Before acting on a cross, check whether price has been trending at all. A smoother oscillator still whipsaws in a range; it simply whipsaws more slowly, which can be harder to notice than the obvious chop of a fast line.
True Strength Index FAQs
Who created the True Strength Index?
The True Strength Index was developed by William Blau, a technical analyst known for applying double exponential smoothing to momentum-based indicators to reduce noise while keeping them responsive to real trend changes.
Is TSI better than a single-smoothed momentum indicator?
TSI's second smoothing pass is designed to filter out more short-term noise than a single-smoothed momentum reading, which can make its signals steadier. That comes at the cost of additional lag, so "better" depends on whether a trader values noise reduction or faster response more.
How is TSI different from MACD?
Both are momentum oscillators built from exponential smoothing and both are commonly read with a signal-line crossover. MACD is built from the difference between two EMAs of price; TSI is built from double-smoothed price momentum (change) and double-smoothed absolute momentum, which changes how the two lines behave around the zero line.
What does it mean when TSI crosses zero?
A TSI reading above zero indicates that double-smoothed upward momentum has outweighed downward momentum over the lookback period, and a reading below zero indicates the opposite. A zero-line cross is often treated as a broad trend-direction signal, distinct from the tighter signal-line crossover.
Can TSI be used alone to time trades?
Most technical analysts treat TSI as one input rather than a standalone trigger. Like other momentum oscillators, it can give false signals in choppy or range-bound markets and works best combined with trend context, price action, or other confirming tools.
What are the default TSI smoothing periods?
William Blau published the indicator using a 25-period first smoothing and a 13-period second smoothing applied to the price change, with a signal line commonly set around 7 to 13 periods. Those are the values most platforms ship. As with every published default they are a convention, and changing them changes both how quickly the line turns and how far it travels.
What does the TSI denominator do?
It divides the double-smoothed price change by the double-smoothed absolute price change, which converts an unbounded quantity into a ratio bounded between minus one hundred and plus one hundred. The numerator carries direction because gains and losses offset; the denominator carries magnitude because the absolute values do not. The ratio therefore describes what share of recent movement was directional.
Can TSI cross its signal line while remaining far from zero?
Yes, and the two events answer different questions. The zero crossing reports that the balance of smoothed price change has switched sign, which is a statement about direction. A signal-line crossing reports that TSI has turned relative to its own recent trajectory, which can happen well inside positive or negative territory. Treating the two as interchangeable confuses a change of direction with a change of pace.
Does TSI actually reach its theoretical bounds?
Rarely. Touching plus or minus one hundred would require every price change across both smoothing windows to have the same sign, which the double smoothing makes very unlikely in practice. Readings therefore cluster well inside the bounds, and what counts as an extreme has to be judged against the instrument own history rather than against the theoretical limits.