
Direct Answer
Stochastic RSI (StochRSI) is a momentum oscillator that applies the stochastic oscillator's formula to RSI values instead of raw price, measuring where the current RSI sits relative to its own high-low range over a lookback period. Because it's a derivative of an already-smoothed indicator, StochRSI moves faster and swings between overbought and oversold levels more often than plain RSI, which can flag momentum shifts earlier but also generate more false signals in choppy conditions.
Key Takeaways
- Stochastic RSI applies the stochastic formula to RSI values, not to price.
- It typically ranges from 0 to 1 (or 0 to 100 when scaled), just like the underlying stochastic oscillator.
- It moves faster and more sensitively than plain RSI because it's a derivative of an already-smoothed calculation.
- More sensitivity means more frequent overbought/oversold readings, earlier signals, but also more false ones in sideways markets.
- Common configurations pair a 14-period stochastic calculation with a 14-period RSI, often smoothed into %K and %D lines.
- StochRSI reflects momentum conditions, not a price forecast, and works best alongside other confirmation tools.
What Is Stochastic RSI?
The stochastic oscillator, developed for gauging where price sits within a recent trading range, normally compares the current closing price to the high-low range over a lookback period. Stochastic RSI takes that same normalization formula and applies it to RSI values instead of price: it looks at where the current RSI reading falls relative to the highest and lowest RSI values over the same lookback window, then expresses that position on a 0-to-1 (or 0-to-100) scale.
Because RSI is itself a smoothed, bounded momentum reading, running the stochastic formula on top of it produces an indicator that reacts to small shifts in RSI more dramatically than RSI reacts to shifts in price. The result is a faster, more sensitive oscillator that spends more time near its extremes.
How Does Stochastic RSI Work?
StochRSI is calculated over a chosen lookback period (commonly 14 bars, matching the standard RSI period): (Current RSI − Lowest RSI over the period) ÷ (Highest RSI over the period − Lowest RSI over the period). The result is a value between 0 and 1, often multiplied by 100 for readability. A reading near 1 (or 100) means the current RSI is near the top of its recent range; a reading near 0 means RSI is near the bottom of its recent range.
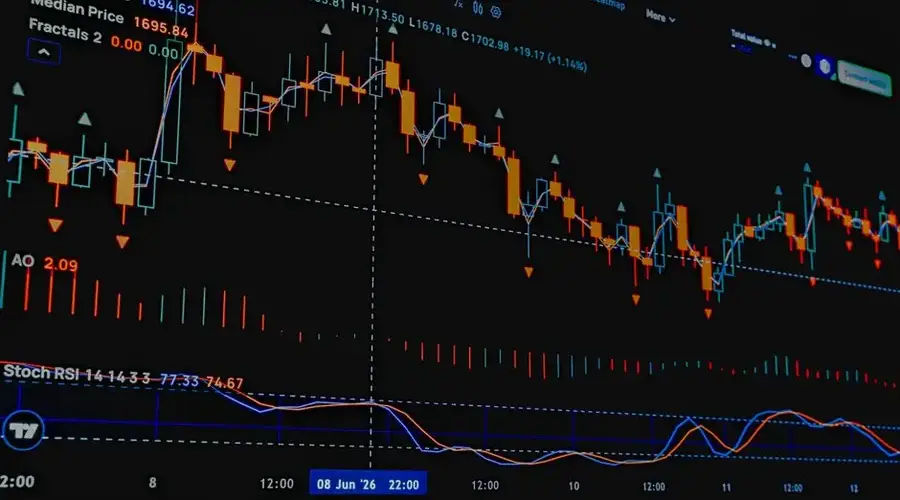
Because it's measuring RSI's position within RSI's own recent range, not price directly, small movements in RSI can push StochRSI from one extreme to the other quickly. This is why the indicator is often smoothed with short moving averages (producing %K and %D lines, echoing the classic stochastic oscillator) to reduce noise before traders act on crossovers or extreme readings.
Why Does the Extra Sensitivity Matter?
Consider a stock whose RSI has been drifting between 45 and 60 for several weeks, never reaching the classic overbought/oversold thresholds that plain RSI relies on. Because StochRSI rescales that narrow RSI range to its own 0-to-1 scale, the same drift can push StochRSI all the way to its extremes, flagging "overbought" or "oversold" conditions that plain RSI never would have shown. That earlier signal can be useful for traders watching for momentum shifts, but in a market that's genuinely just range-bound rather than trending, those extreme StochRSI readings can flip back and forth repeatedly, generating signals that don't lead anywhere.
Limitations and Common Mistakes
- Treating every extreme reading as a trade signal. StochRSI's sensitivity means it hits 0 or 1 far more often than RSI hits 30/70, many of those touches are noise, not reversals.
- Ignoring the broader trend. In a strong uptrend, StochRSI can stay pinned near its upper extreme for extended periods; treating that as "overbought, sell" ignores the trend context.
- Using StochRSI in isolation. Because it's a derivative of a derivative (stochastic-of-RSI-of-price), it's most useful as a confirmation tool alongside price action, volume, or other indicators, not a standalone signal.
- Skipping the smoothing step. Raw, unsmoothed StochRSI is very choppy; most practitioners apply a short moving average (%K/%D) before interpreting crossovers.
When StochRSI Speed Works Against You
The decision this page settles is whether StochRSI replaces RSI or sits beside it. It does not replace it. StochRSI measures where RSI sits within RSI own recent range, so it is a reading about a reading, and its extremes describe something different. An RSI of 58 can produce a StochRSI of 1.00 if 58 happens to be the highest RSI value in the lookback window.
That is precisely the mistake the indicator invites. Because it rescales whatever range RSI happened to occupy onto a full 0-to-1 scale, StochRSI reaches its extremes far more often than RSI reaches 70 or 30, and every touch looks like an event. In a genuinely range-bound market it will pin at one end, snap to the other and repeat, with none of those trips corresponding to a move worth trading. In a strong trend it can sit near the top of its scale for a long stretch, and reading that as an instruction to sell is a bet against the trend taken on the word of an indicator that has no view on trend at all.
Two checks before acting. Confirm you are looking at smoothed %K and %D lines rather than the raw calculation, because unsmoothed StochRSI is choppy by construction. And read the underlying RSI value alongside it, since a StochRSI extreme built on RSI drifting between 45 and 60 describes a market that is not stretched in any meaningful sense.
Frequently Asked Questions
Is Stochastic RSI better than regular RSI?
Neither is universally better, Stochastic RSI is more sensitive and reacts faster to price changes, which can surface momentum shifts earlier, but that same sensitivity produces more overbought/oversold readings, including more false signals in choppy or range-bound markets. Regular RSI is smoother and generally more reliable as a standalone gauge.
What is a good Stochastic RSI setting?
The most common configuration applies a 14-period stochastic calculation to a 14-period RSI, often smoothed with a %K and %D moving average, mirroring the classic stochastic oscillator's default settings. Traders adjust these periods based on the asset and timeframe, but no single setting works for every market.
Why does Stochastic RSI move so fast?
Stochastic RSI is a derivative of an already-smoothed indicator: it takes RSI values, which themselves compress price momentum into a 0-100 range, and rescales where the current RSI sits relative to its own recent high-low range. That extra layer of transformation amplifies small changes, making the line move more quickly and hit its extremes more often than plain RSI.
Does Stochastic RSI predict price direction?
No. Stochastic RSI measures where recent RSI values sit within their own range, which reflects momentum, not a forecast of future price. An overbought or oversold reading describes current conditions and is commonly used alongside other analysis, not as a standalone prediction.
What are the three parameters of Stochastic RSI?
The RSI period, the lookback window over which the stochastic calculation locates the current RSI value, and the smoothing applied to the resulting line. Many platforms expose only the last two and use a default for the first, which means two charts labelled identically can be computing different things. Establishing all three is necessary before comparing a reading against anything published.
Does Stochastic RSI look at price at all?
Only through RSI. The stochastic step takes RSI values as its input and never touches price directly, so the output describes where RSI sits within its own recent range. That is a statement about a derived series rather than about the market. It explains why the indicator can be pinned at an extreme while price is doing something unremarkable: RSI has been steady, and the indicator is reporting on RSI.
What does a reading of exactly zero or one mean?
That RSI is currently at the lowest or highest value within its lookback window, and nothing more. It does not mean price is at an extreme, that a move is exhausted, or that RSI itself is at a notable level. RSI could be sitting in the middle of its own range at a perfectly ordinary value and still be the highest reading of the last fourteen bars, which is enough to produce the maximum output.
Can Stochastic RSI diverge from RSI itself?
Yes, and the mechanism is straightforward once the construction is clear. RSI can rise steadily while its position within its own trailing range falls, if the range is expanding faster than RSI is climbing. The two are then pointing in different directions on the same chart. This is not a signal of anything; it is the expected behaviour of a range-position measure applied to a series that is itself moving.
Is Stochastic RSI suited to reading trend?
Its construction works against that use. Two layers of transformation and a short effective memory make it move quickly and reach its bounds often, which is useful for identifying short-term extremes and unhelpful for describing a sustained direction. During a long trend it spends much of its time pinned, which conveys very little. A trend reading is better taken from something that does not saturate.
References
Disclaimer
This page is for educational purposes only and does not constitute investment, financial, or trading advice. Technical indicators like Stochastic RSI describe past price behavior and do not guarantee future results. Do your own research and consider consulting a licensed financial professional before making investment decisions.