

Direct Answer
Transaction costs -- commissions, fees, and the bid-ask spread -- and slippage, the gap between an expected execution price and the actual fill price, are real costs of implementing any technical trading strategy. They're easy to leave out of a simplified backtest, and strategies that generate frequent trading signals are more sensitive to them because the costs accumulate with each trade. A strategy that looks profitable before these costs are properly included can turn unprofitable once they are.
Key Takeaways
- Transaction costs cover commissions, fees, and the bid-ask spread paid on every trade.
- Slippage is the difference between the price a signal implied and the price actually filled.
- Both are commonly omitted from simplified backtests, which can overstate a strategy's real-world results.
- Higher trading frequency generally means greater sensitivity to these costs, since they accumulate with each additional trade.
- A strategy that appears profitable before costs can become unprofitable once realistic costs are included.
What Are Transaction Costs and Slippage?
Transaction costs are the commissions, fees, and bid-ask spread a trader pays to enter and exit a position. Commissions and fees are typically charged directly by a broker or exchange. The bid-ask spread is the gap between the best price a buyer is willing to pay and the best price a seller is willing to accept at a given moment -- crossing that spread to execute immediately is itself a cost, even when no explicit commission is charged.
Slippage is a related but distinct cost: the difference between the price a trader expected to receive, based on a signal or a quoted price, and the price the order actually fills at. Slippage can occur for many reasons, including the time it takes an order to reach the market, the size of the order relative to available liquidity, and how quickly the price is moving when the order executes.
Both costs are real costs of implementing any technical trading strategy in live markets. They are also easy to omit from a simplified backtest or historical analysis, which often assumes trades fill instantly and exactly at a signal's price with no commission attached. That gap between a simplified model and real execution conditions is exactly what transaction costs and slippage represent.
Why It Matters: Frequency Compounds the Cost
Strategies that generate frequent trading signals are more sensitive to transaction costs and slippage, since these costs accumulate with each trade. A strategy that enters and exits positions often will pay commissions, cross the spread, and absorb slippage many more times over a given period than a strategy that trades rarely -- even if each individual instance of cost looks small.
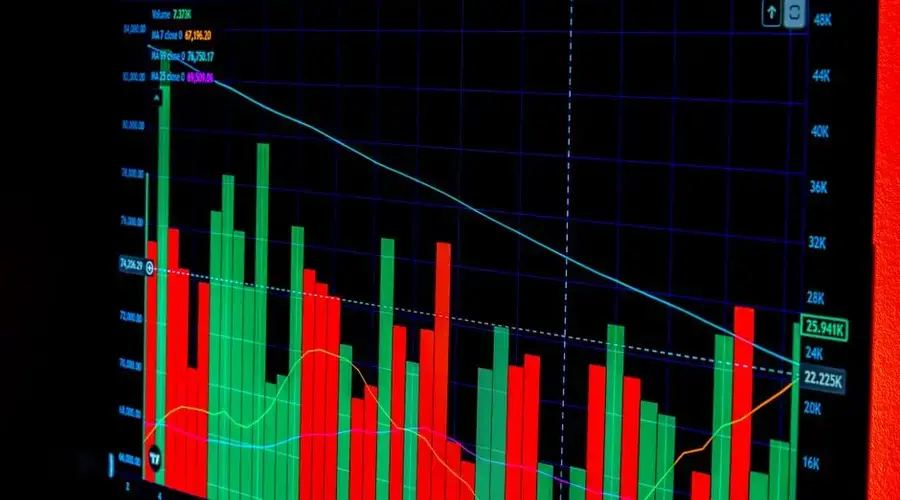
Hypothetical example -- for education only.
Consider two strategies backtested over the same period, both showing a raw, cost-free return of 5% before any adjustment. Strategy A generates 10 round-trip trades over the period. Strategy B generates 200 round-trip trades over the same period, using a much shorter-term signal. If each round-trip trade carries a combined cost from commissions, spread, and slippage of 0.1% of position value, Strategy A's total cost drag is roughly 10 × 0.1% = 1%, leaving an approximate net return of 4%. Strategy B's total cost drag is roughly 200 × 0.1% = 20%, which would turn its 5% raw return into an approximate net result of -15%. The two strategies can look similar before costs and very different after them -- illustrating why trading frequency is a central factor in how much transaction costs and slippage matter to a given approach.
Common Mistakes and How to Apply This
- Testing a strategy with zero costs assumed. A backtest that assumes every trade fills exactly at the signal price with no commission is measuring a strategy that doesn't exist in live markets.
- Ignoring the effect of signal frequency. Two strategies with similar raw returns can have very different net returns once cost accumulation from trade frequency is accounted for.
- Treating spread and slippage as the same thing. The bid-ask spread is a cost of crossing the market at a given moment; slippage is the additional gap between an expected price and the actual fill, which can be affected by factors like order timing and liquidity.
- Underestimating costs for less liquid instruments. Spread and slippage generally tend to be more significant where liquidity is thinner, though there is no universally correct estimate that applies to every market or instrument.
- Not revisiting cost assumptions as a strategy's trading frequency changes. If a strategy is adjusted to trade more often, its sensitivity to transaction costs and slippage generally increases along with it.
There is no universally correct way to model these costs for every strategy or market, but building explicit, realistic assumptions for commissions, fees, spread, and slippage into a backtest -- rather than adding them as an afterthought -- is a commonly recommended way to keep a historical analysis closer to what a strategy would actually experience in live trading.
Turnover Decides How Much Costs Matter
The same cost per trade lands very differently depending on how often you trade, and that is the number to look at before worrying about the size of any individual fee. A strategy holding for months absorbs a spread and a commission across a long expected move. A strategy trading several times a week pays it repeatedly against much smaller expected moves, and the accumulated friction can exceed the entire edge without any individual trade looking expensive.
Which makes turnover the first thing to check when a backtest looks strong. A high-frequency rule with no cost model is not slightly optimistic; it may be describing a result that reverses sign once realistic execution is included, and the shorter the average hold, the more likely that is.
Slippage is the component most often left out entirely, since it does not appear on a fee schedule. It is the gap between the price the signal implied and the price actually filled, and it varies with volatility, order size and how liquid the instrument is at the moment you act rather than on average.
Including a deliberately conservative estimate is more useful than including a precise one. If a strategy survives a pessimistic cost assumption it is probably real; if it only works under an optimistic one, the cost model has become part of the edge.
Frequently Asked Questions
What are transaction costs in technical analysis?
Transaction costs are the commissions, fees, and bid-ask spread paid every time a trade is entered or exited. They are a real cost of implementing any technical trading strategy and are easy to leave out of a simplified backtest or historical analysis.
What is slippage and how is it different from a spread?
Slippage is the difference between an expected execution price and the actual fill price. The bid-ask spread is a separate, related cost -- the gap between the best available buy and sell price at a given moment. Both can widen the gap between a strategy's theoretical and realized results.
Why are frequent-trading strategies more sensitive to these costs?
Strategies that generate frequent trading signals are more sensitive to transaction costs and slippage since these costs accumulate with each trade. A strategy that looks profitable before accounting for realistic transaction costs and slippage can become unprofitable once they're properly included.
Can transaction costs turn a profitable backtest into a losing strategy?
Yes. A strategy that appears profitable before accounting for realistic transaction costs and slippage can become unprofitable once they're properly included, which is why these costs are commonly built into a backtest rather than added as an afterthought.
How can a trader account for transaction costs and slippage when testing a strategy?
There is no universally correct approach, but traders commonly model per-trade commissions and fees explicitly, and estimate slippage using realistic assumptions about spread and execution conditions, rather than assuming trades fill exactly at the signal price.
Does slippage always work against the trader?
No. A market order can be filled better than expected when price moves favourably between the decision and the execution, and that happens regularly. What makes slippage a net cost in most models is the asymmetry: adverse slippage tends to be larger, because the situations that produce fast movement are also the ones where liquidity thins. The average is what matters, and it usually sits on the unfavourable side.
How does order type change the cost profile?
A market order pays the spread and whatever impact its size causes, and it is certain to execute. A limit order avoids paying the spread and may earn it, at the cost of not executing when price moves away, which is a real expense that never appears on a trade confirmation. Comparing the two on realised fills alone flatters the limit order, because the trades it missed are invisible.
What does a stop order actually cost when it triggers?
A conventional stop becomes a market order once the trigger price trades, so the fill is whatever the book offers at that moment rather than the stop price. In a fast move or a gap the difference can be substantial. A stop-limit avoids that by capping the price, and in exchange it may not fill at all, leaving the position open through the move it was meant to close.
How should costs be modelled in a backtest that only has daily bars?
Conservatively, because the intraday path is unknown. With only four prices per day there is no way to establish where within the session a fill would have occurred, so any assumption is a modelling choice. The usual approach combines a per-trade cost estimate with a deliberately unfavourable fill convention, and then checks how much of the result survives when that assumption is made worse.