
Direct Answer
Price discovery is the ongoing process by which a market determines the price of a security through the interaction of buy orders (demand) and sell orders (supply). When demand exceeds supply at a given price, prices tend to rise as buyers compete for available shares; when supply exceeds demand, prices tend to fall as sellers compete to find buyers. Technical analysis exists because this negotiation leaves visible traces in price and volume data that traders can study.
Key Takeaways
- Price discovery is continuous, not a single calculation -- it happens every time a buy order and a sell order interact.
- When demand exceeds supply at a given price, prices tend to rise; when supply exceeds demand, prices tend to fall.
- Technical analysis is the study of the visible traces this supply-and-demand negotiation leaves in price and volume data.
- Because the negotiation never stops, there is generally no single "correct" price -- only the price the market is currently agreeing on.
What Is Price Discovery?
Price discovery is the ongoing process by which a market determines the price of a security through the interaction of buy orders (demand) and sell orders (supply). It is not a committee decision or a formula applied once a day -- it is the running total of every order that reaches the market, matched against every other order willing to trade at that moment.
At any instant, some participants want to buy at or below a certain price, and others want to sell at or above a certain price. When demand exceeds supply at a given price, prices tend to rise as buyers compete for available shares -- a buyer who is unwilling to wait may raise the price they are willing to pay to get filled. When supply exceeds demand, prices tend to fall as sellers compete to find buyers -- a seller who wants to exit now may lower the price they are willing to accept.
This back-and-forth repeats continuously while a market is open. Each trade that results is simply the point where a buyer's willingness to pay and a seller's willingness to accept happened to meet. The next trade may occur at a different price because the balance of demand and supply has already shifted, even slightly.
Why Price Discovery Is the Foundation of Technical Analysis
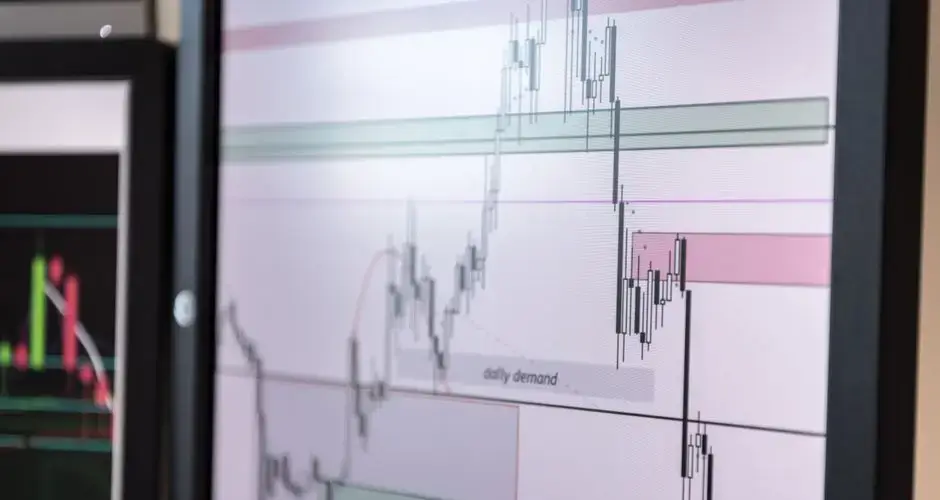
Technical analysis is fundamentally the study of the visible traces this ongoing supply-and-demand negotiation leaves behind in price and volume data. A rising trend is generally read as a record of demand outpacing supply over that stretch of time; a falling trend is generally read as the reverse. A support level is generally interpreted as a price where demand has previously stepped in to absorb selling; a resistance level is generally interpreted as a price where supply has previously stepped in to absorb buying. None of this is a law of physics -- it is a description of where buyers and sellers have historically shown up.
Hypothetical example -- for education only. Suppose a stock trades in a narrow range near $50 for several sessions, with roughly equal buy and sell orders arriving at that level -- an illustration of supply and demand in rough balance. Now suppose new buy orders start arriving in noticeably larger size than the sell orders available at $50. Under the mechanics described above, buyers competing for a limited number of shares would be expected to push transactions to $50.50, then $51, as sellers at those higher prices become willing participants. A chart of that period would show a breakout above $50 accompanied by an increase in volume. A technical analyst reading that chart is not detecting a mysterious pattern -- they are reading a record of demand having exceeded supply at the old price.
How to Apply This -- and Common Mistakes
Keeping the supply-and-demand basis of price discovery in mind changes how a chart should be read:
- Treat patterns as evidence, not causes. A trendline or support level does not move price by itself -- it is a summary of where buy and sell orders have previously clustered. Mistaking the pattern for the cause of future price movement is a common error.
- Watch volume alongside price. A price move on unusually light volume reflects a smaller shift in the supply-and-demand balance than the same move on heavy volume, since fewer buy and sell orders were involved in reaching that price.
- Expect the balance to keep shifting. Because price discovery is ongoing, a level that reflected strong demand in the past is not guaranteed to do so again -- the participants and their orders at that price can be entirely different the next time it is tested.
- Don't expect one explanation to fit every move. There is commonly no universally correct explanation for why a price moved at a given moment, since price discovery reflects the combined, often unobservable, motivations of many buyers and sellers at once.
There Is No Correct Price, Only the Current One
Price discovery being continuous has a consequence worth sitting with: there is no correct price sitting somewhere waiting to be found, only the price buyers and sellers are currently agreeing on. That removes a familiar mental move. Language like the stock should be at some level, or price is wrong here, is importing a valuation judgment from outside the chart, and the chart itself has no opinion about it.
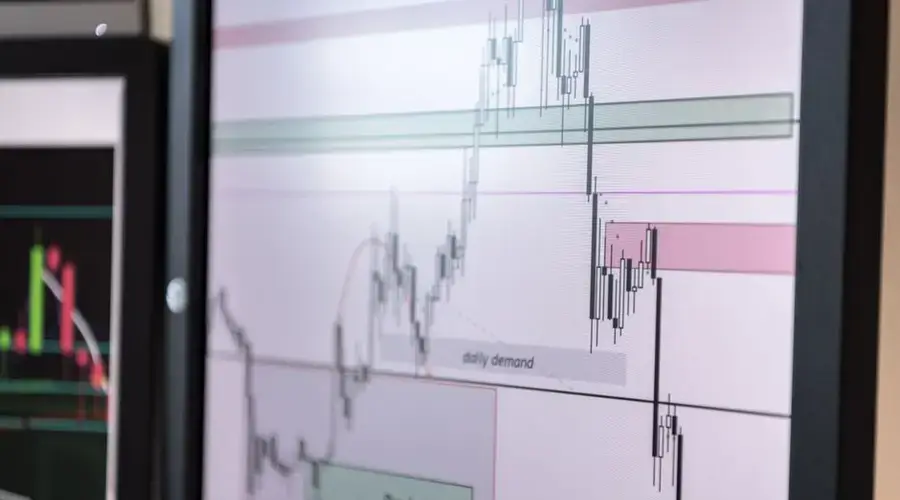
What technical work studies is the residue of the negotiation rather than its correctness. A level where price stalled repeatedly records that supply met demand there several times. That is a factual observation about behaviour, and it says nothing about whether anyone was right to transact at that price.
Keeping the two separate makes analysis cleaner. A view that a security is mispriced is a fundamental claim that a chart can neither support nor refute, and blending it into a technical read produces a thesis with two sources and one stated justification.
It also explains why levels stop working. If price is the current state of an ongoing negotiation, then a change in who is participating or what they know changes the outcome, and the previous agreement has no authority over the new one.
Frequently Asked Questions
What is price discovery in the stock market?
Price discovery is the ongoing process by which a market determines the price of a security through the interaction of buy orders (demand) and sell orders (supply). It is not a single event but a continuous negotiation that plays out every time an order reaches the market.
Why do prices rise when demand exceeds supply?
When demand exceeds supply at a given price, buyers compete for the available shares. That competition commonly pushes prices higher as buyers raise their bids to get filled, while sellers who notice strong demand can hold out for better prices.
How does technical analysis relate to supply and demand?
Technical analysis is fundamentally the study of the visible traces this ongoing supply-and-demand negotiation leaves behind in price and volume data. Chart patterns, trends, and volume signatures are read as evidence of shifting buying and selling pressure, not as forces in themselves.
Does price discovery ever stop?
No. Price discovery is generally described as an ongoing process rather than a one-time calculation. As long as a market is open and orders continue to arrive, the balance of supply and demand keeps being renegotiated and the price keeps adjusting.
Can price move without new supply or demand information?
Price moves whenever the balance between buy orders and sell orders shifts at the current price level, which can happen even without a clear news catalyst. This is one reason there is commonly no universally correct explanation for every short-term price move -- order flow itself is part of the story.
Is technical analysis the only way to study supply and demand?
No. Fundamental analysis looks at the underlying business or economic drivers that can shift supply and demand over longer horizons, while technical analysis focuses on the visible traces those shifts leave in price and volume. Many traders use the two approaches together.
What is the difference between the quoted price and the price at which size can trade?
The quote shows the best bid and offer along with the quantity available at those levels, which can be small. An order larger than that quantity works through successively worse levels, so the average price it achieves is different from the quote it saw. Depth of book describes how much is resting at each level, and it is the relevant quantity for anything traded in size.
How does an auction differ from continuous trading in price discovery?
Continuous trading matches orders one against another as they arrive, so the price walks. An auction accumulates orders over a period and crosses them all at a single price chosen to maximise the volume that can trade. That concentrates information from many participants into one print, which is why opening and closing auctions carry a large share of daily volume and why those prices are used as references.
Does a trading halt stop price discovery?
It stops the mechanism for that security, but not the flow of information. Indicative prices published during a halt, related instruments such as options and index futures, and the security own listing on other venues where trading continues all convey something about where the market has moved. When trading resumes it frequently does so at a materially different price, which reflects discovery that happened while the book was closed.
Related Reading
- Technical Analysis Hub -- the full library of technical-analysis foundations, indicators, and strategy pages.
- What Is RSI? -- see how one widely used indicator translates the pace of recent buying and selling pressure into a single reading.
- Backtesting -- test how a rule built on price and volume behavior would have performed historically before relying on it.
References
- CMT Association -- professional body for the Chartered Market Technician designation and technical-analysis methodology.
- CFA Institute Research and Policy Center -- research on market structure, price formation, and investment analysis.
- SEC Investor.gov -- investor education resources from the U.S. Securities and Exchange Commission.