

Direct Answer
Crypto technical analysis uses the same core tools as equity technical analysis - trendlines, moving averages, oscillators, chart patterns - but the two markets differ structurally in ways that change how those tools should be interpreted. Crypto trades 24/7 with no session opens or closes, liquidity is fragmented across many exchanges with no single consolidated tape, and typical volatility runs higher, all of which affect how gaps, volume, and indicator signals should be read.
Key Takeaways
- Crypto markets trade continuously, 24 hours a day, seven days a week - equity markets have defined sessions with opens, closes, and weekend gaps.
- Without session boundaries, crypto rarely produces true overnight gaps the way equities do around scheduled news or earnings.
- Crypto liquidity is fragmented across many separate exchanges, each with its own order book and price.
- There is no crypto equivalent of the National Best Bid and Offer (NBBO) that consolidates equity quotes into one reference price.
- Crypto assets, especially outside the largest few, typically exhibit higher volatility than most listed equities.
- Volume data reliability varies more across crypto exchanges than across regulated equity venues.
- Standard indicator lookback periods popularized in equity markets may need adjustment for continuous, higher-volatility crypto price action.
- Support/resistance levels and chart patterns can look different depending on which exchange's price data a chart uses.
Continuous 24/7 Trading vs Session-Based Markets
Equity markets operate within defined trading sessions - a market open, a market close, and gaps in between including overnight and weekends. Many equity TA concepts are built around this structure: gap-fill patterns, opening-range breakouts, and the significance of the first and last hour of a session all depend on there being a defined session boundary in the first place.
Crypto markets have no such boundary. Price action can develop at any hour of any day, and because there is no scheduled close, there is no natural pause point analogous to an equity market close where positioning resets overnight. A hypothetical crypto asset can post a sharp move at 3 a.m. in a given time zone with the same structural significance as a move at 3 p.m. - equity TA concepts that lean on session timing need to be reinterpreted or dropped rather than applied unchanged.
Fragmented Liquidity vs a Consolidated Tape
In U.S. equity markets, trades and quotes across multiple exchanges are consolidated into a single reference feed, so a chart of a given ticker reasonably reflects the whole market's activity in that stock. Crypto has no equivalent consolidated tape. The same asset can trade at slightly different prices simultaneously across many separate exchanges, each with its own order book depth and its own participants.
This means a support or resistance level that appears clean on one exchange's chart might look different, or not appear at all, on another exchange's data for the same asset. A hypothetical trader analyzing a breakout above a round-number level on one venue's chart should recognize that the same breakout might already have happened, or might not yet have happened, on a different venue - fragmentation that has no real equity-market analog for a single listed stock.
Volatility and Indicator Settings
Popular indicator defaults - a 14-period RSI, a 20-period moving average, a 12/26/9 MACD - were largely developed and popularized in equity markets with comparatively lower typical volatility and defined sessions. Applied unchanged to a crypto asset trading continuously with a higher typical volatility profile, the same settings can behave differently: oscillators may spend more time in overbought or oversold territory, and moving averages calculated on a fixed number of periods may represent a very different span of real time depending on the asset's trading pattern.
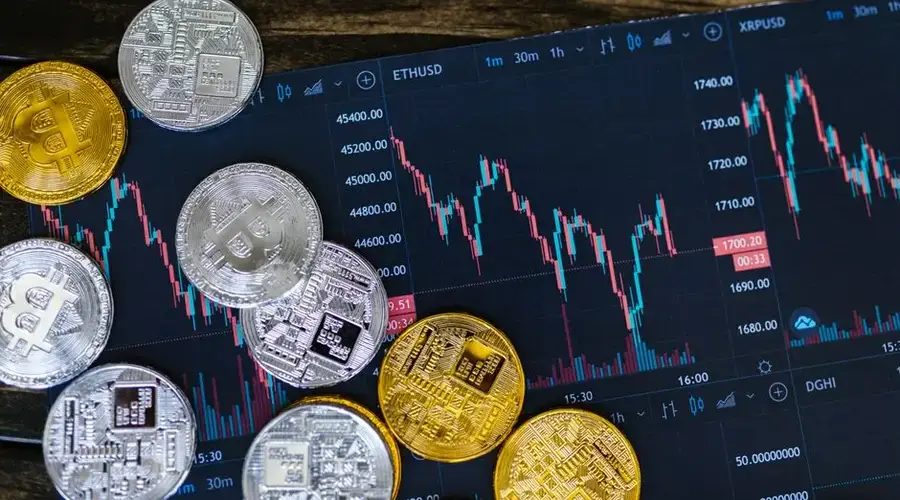
This does not mean equity-style indicators are unusable on crypto charts - many traders apply them successfully - but it does mean the settings and thresholds that work well for a lower-volatility equity often need to be reconsidered rather than assumed to transfer directly.
Limitations and Common Mistakes
- Assuming equity-market gap logic applies. True gaps are rare in continuously-traded crypto, so gap-based patterns from equity TA often don't translate directly.
- Charting from a single exchange without context. A chart built from one venue's data may not represent the broader fragmented market, especially for lower-liquidity assets.
- Using default indicator settings unchanged. Equity-market default periods and thresholds may not suit a continuously-trading, higher-volatility asset without adjustment.
- Trusting volume figures uncritically. Reported volume reliability varies across crypto exchanges more than across regulated equity venues.
- Ignoring fragmentation when reading order-book-based signals. Depth and liquidity visible on one exchange may not reflect the asset's true aggregate liquidity.
Which Chart Habits Survive the Move From Equities to Crypto
Take the structural reading with you and leave the calibration behind. Support, resistance, trend and volume confirmation describe how order flow behaves, and order flow behaves recognisably in both markets. What does not transfer is every number attached to those ideas.
Three adjustments do most of the work. First, sessions: an equity chart has an open, a close and a gap between them, while a continuously traded asset has none of those, so patterns built around opening ranges or closing prints lose their anchor. Second, volatility: an indicator tuned to equity daily ranges will read as extreme far more often on an asset that routinely moves several times that. Third, volume: exchange-reported crypto volume is not consolidated and not uniformly audited, so a volume confirmation is only as good as the venue reporting it.
The mistake this creates is silent. A trader carries a familiar setting across, sees it fire more frequently, and reads the extra signals as more opportunity rather than as the same tool badly scaled.
Chart analysis in either market says nothing about why price moved. In crypto the gap is wider, because token unlocks, protocol changes and exchange outages produce price action that looks technical and is not.
Frequently Asked Questions
Why does 24/7 crypto trading change how technical analysis works?
Equity markets have defined opens and closes, producing overnight and weekend gaps that many equity TA patterns and indicators implicitly account for. Crypto trades continuously with no session boundaries, so there are no true opening gaps, and price action can develop at any hour without the natural pauses equity traders use to reassess. Indicators and patterns built around session structure need to be reinterpreted, not applied unchanged.
What does fragmented liquidity mean for crypto charting?
Equities trade through a regulated, consolidated view of quotes and trades across venues, so a single ticker's chart reasonably represents the whole market. Crypto assets often trade across many separate exchanges with their own order books and no single consolidated tape, so price, volume, and even support/resistance levels can differ meaningfully depending on which exchange's data a chart is built from.
Do standard indicator settings like a 14-period RSI transfer directly from stocks to crypto?
Not necessarily. Standard indicator lookback periods were largely popularized in markets with defined trading sessions and comparatively lower typical volatility. Applied unchanged to a continuously trading, higher-volatility crypto asset, the same settings can behave differently - potentially generating more frequent overbought/oversold signals - so some analysts adjust periods or thresholds rather than assuming equity-market defaults transfer without changes in behavior.
Is crypto volume data as reliable as equity volume data?
Crypto volume figures vary more in reliability across exchanges than equity volume, which is captured under regulated reporting requirements. Some crypto trading venues have faced scrutiny over inflated reported volume, and fragmented liquidity means no single exchange's volume represents total market activity, so volume-based technical signals warrant more source scrutiny in crypto than in equities.
Which exchange's chart should I use for crypto technical analysis?
Ideally the venue you will actually trade on, since that is where your orders will interact with real liquidity and where the levels you draw will be tested. Aggregated index charts smooth out venue-specific wicks and can show levels that never existed on any single book. Where you must use an aggregate, be aware that a level drawn on it may not correspond to anything on your execution venue.
How do I handle candle close times when crypto has no daily session boundary?
The boundary is a convention set by the charting platform, most commonly at coordinated universal time midnight, and different providers can use different cutoffs. That means a daily candle pattern visible on one platform may not appear on another. Since patterns depend on where candles are cut, picking one convention and staying with it matters more than which convention you pick.
Do gap-based patterns from equity charting appear in crypto?
Traditional gaps arise because equity markets close and reopen, so continuous crypto trading produces far fewer of them on spot charts. Gaps do appear on crypto futures products that have session breaks, and rapid moves through thin books can create candle structures that resemble gaps without being one. Patterns whose logic depends on an overnight halt do not transfer directly to a market that never halts.
Are support and resistance levels less reliable in crypto than in equities?
The concept transfers, but the evidence behind any given level is often weaker because volume is split across venues and a meaningful share of reported volume may not represent genuine trading. A level built on volume from a single venue with dependable reporting carries more information than one built on aggregated figures of uncertain quality. The reliability question is really a data quality question.
Should indicator lookback periods be shortened for crypto's higher volatility?
Shortening a lookback makes an indicator respond faster and produce more signals, most of which will be noise in a volatile market, so it often makes the problem worse rather than better. Lengthening reduces false signals at the cost of later entries. Neither adjustment has a correct answer, and settings tuned to fit past crypto price history are especially prone to describing that history rather than generalising beyond it.
Related Reading
Disclaimer
This content is for educational purposes only and does not constitute investment, financial, tax, or legal advice. Swoopr Investment does not recommend any specific cryptocurrency, exchange, or trading strategy. Technical analysis concepts described here are one input among many and should not be used in isolation to make investment decisions. See our Financial Disclaimer for more information.