
Direct Answer
On-Balance Volume (OBV) is a cumulative signed-volume indicator that adds volume on up closes and subtracts volume on down closes. A higher reading generally means the cumulative line has risen, reflecting more volume assigned to up-closing periods than down-closing periods; a lower reading generally means the cumulative line has fallen. The main limitation is that it assigns the entire period volume based only on close-to-close direction and cannot identify who traded or why.
On-Balance Volume (OBV): Formula, Meaning, Signals, Examples and How to Use It
How Is On-Balance Volume Calculated?
On-Balance Volume is a running total that adds a period's whole volume when the close is above the prior close, subtracts it when the close is below, and leaves the total unchanged when the closes are equal. It was introduced by Joseph Granville.
Formula: OBV(t) = OBV(t-1) + Volume if Close(t) is above Close(t-1); OBV(t-1) - Volume if below; OBV(t-1) if equal
Inputs:
- Close of each period
- Volume of each period
- A starting value (any base, often zero)
- No lookback setting: the total is cumulative
Worked example. With a prior OBV of 50,000, a close that rises from 20.00 to 20.50 and volume of 12,000, the new On-Balance Volume is 62,000. The inputs are illustrative numbers, not market data.
Reading it. A rising OBV means volume on up closes has exceeded volume on down closes since the start. The slope and its relation to price are what matter: for example, price reaching a new high while OBV does not is read as a divergence. The absolute level has no standard meaning.
Limits. The entire period's volume is assigned by the close-to-close direction alone, so a one-cent rise counts the same as a large rally. It cannot identify who traded or why, and the level depends on where the series starts.
Indicator snapshot
| Attribute | Value |
|---|---|
| Abbreviation | OBV |
| Category | Volume |
| Creator / origin | Joseph Granville |
| Primary inputs | Close direction; Volume |
| Common settings | Cumulative; no universal lookback |
| Output | Line/scalar |
| Typical range | Cumulative/unbounded |
| Primary purpose | Measure participation, traded volume, volume-weighted price, or volume-at-price structure. |
| Main limitation | It assigns the entire period volume based only on close-to-close direction and cannot identify who traded or why. |
What is On-Balance Volume?
On-Balance Volume is a cumulative signed-volume indicator that adds volume on up closes and subtracts volume on down closes. It should be treated as a transformation of observable market data, not as an independent source of truth. The useful question is not whether the indicator is “bullish” or “bearish” in isolation, but what specific market property it measures, which assumptions enter the calculation, and whether that information is already duplicated by another tool on the chart.
For Swoopr, the canonical profile should separate definition, calculation, interpretation and decision use. That keeps readers from collapsing a descriptive metric into a trading strategy. An indicator can describe trend, momentum, volatility, participation, positioning or risk without providing a complete entry, exit, sizing or portfolio decision.
What does it measure and why is it used?
Measure participation, traded volume, volume-weighted price, or volume-at-price structure. The practical value is repeatability: the same inputs and formula can be applied across a defined dataset, allowing users to compare readings through time or across instruments when the calculation convention is held constant.
The calculation can still be misleading if the data source, session, adjustment method, smoothing rule or parameter set changes. Two platforms can legitimately report different readings while using different assumptions, so check which conventions a chart uses.
Formula
If Ct>C(t−1): OBVt=OBV(t−1)+Vt; if lower, subtract Vt; if equal, unchanged
Calculation discipline
- Fix the instrument, timeframe and session before computing the indicator.
- Use one documented price/volume source and one corporate-action convention.
- State every lookback, smoothing method and reset rule.
- Handle missing data and zero denominators explicitly.
- Reproduce at least one worked example from raw inputs during QA.
- Compare the implementation with a second independent calculation before publication.
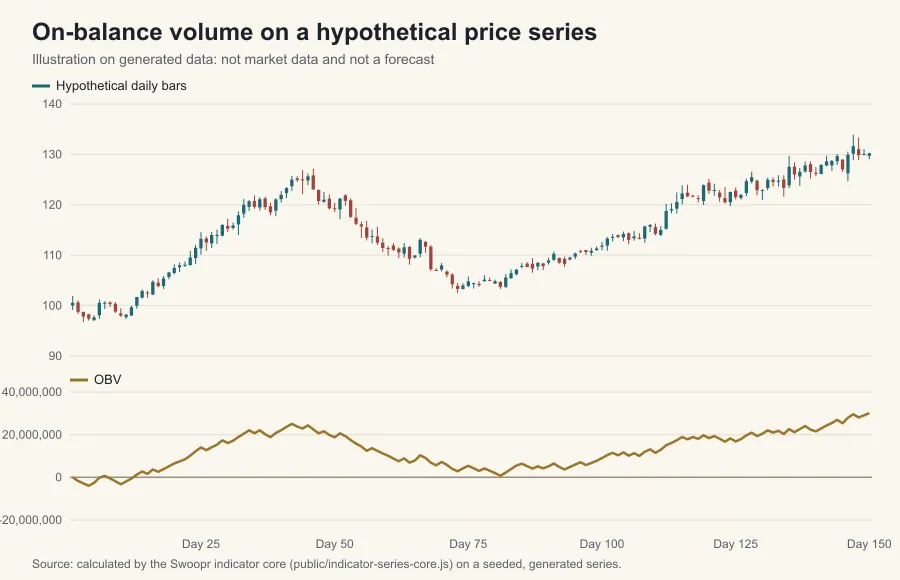
How to read On-Balance Volume
A higher reading generally means the cumulative line has risen, reflecting more volume assigned to up-closing periods than down-closing periods. A lower reading generally means the cumulative line has fallen. That interpretation is descriptive, not predictive. The same numerical state can lead to different outcomes in a strong trend, quiet range, event-driven gap or illiquid market.
Bullish, bearish and neutral context
A bullish interpretation is appropriate only when the reading lines up with the indicator's actual job. For a trend tool, that means direction or trend persistence; for a momentum tool, it means stronger upside momentum; for a volatility measure, “higher” is not bullish at all:it only means larger expected or realized movement. A generic bullish or bearish label therefore does not fit a direction-neutral indicator.
A neutral state should be defined when the indicator does not provide enough evidence for its intended job. This is especially important for bounded oscillators near mid-range, volatility gauges near historical medians, or spread measures near long-run norms.
Common settings
The common reference is Cumulative; no universal lookback. This is a starting convention, not a universally optimal parameter. Shorter lookbacks generally respond faster and produce more state changes; longer lookbacks smooth noise but react later. Parameter selection should be tied to the intended decision horizon, then tested over multiple instruments and regimes rather than optimized to one historical period.
Worked hypothetical interpretation
Suppose a researcher calculates On-Balance Volume with the documented settings across a liquid security and observes a material change in the reading. The first step is to state what changed in the underlying input. The second is to ask whether price structure, volume, volatility or the benchmark environment confirms that interpretation. The third is to define what observation would invalidate it. Only after those steps should the indicator feed a strategy rule.
This sequence prevents a common error: treating the indicator output as if it arrived independently of the price, volume, options or market data used to calculate it.
Best and weak market conditions
On-Balance Volume (OBV) is most useful when the market property it measures is actually relevant to the decision. It is weakest when the regime changes faster than the lookback, the market is illiquid, the input data are incomplete, or the chosen parameter set is mismatched to the timeframe. A trend indicator tends to struggle in ranges; a mean-reversion oscillator can remain extreme during persistent trends; volume-based measures can break when venue coverage changes; options and on-chain measures can be provider-specific.
Strengths
- The calculation needs only closes and volume, so it is simple to reproduce and verify on any chart or data feed.
- Cumulating signed volume makes a long-running imbalance between up-close and down-close volume visible as a sustained slope.
- Reproducible when the formula and data convention are fixed.
Weaknesses and false signals
- It assigns the entire period volume based only on close-to-close direction and cannot identify who traded or why.
- Parameter changes can alter timing and classification.
- Correlated indicators can create false confidence by repeating the same underlying information.
- Historical relationships can fail after market structure or volatility regimes change.
- Backtests can be overstated by look-ahead bias, survivorship bias, unrealistic fills or omitted transaction costs.
Combining On-Balance Volume with other indicators
The strongest combination usually pairs different input families rather than similar formulas. Before adding another indicator, identify the specific error it is supposed to catch and measure how often the two signals disagree. High agreement between two price-only oscillators is not necessarily confirmation; it can be arithmetic redundancy.
Related entities for this profile include: Accumulation/Distribution Line, Anchored VWAP, Chaikin Money Flow, Cumulative Volume Delta, Money Flow Index, Relative Volume.
When not to use it
Do not use On-Balance Volume as a standalone forecast or as a substitute for position sizing, liquidity checks, execution planning or fundamental research when those are relevant to the decision. Avoid publishing “best settings” without a defined asset universe, timeframe, cost model and out-of-sample validation. If the indicator depends on proprietary or provider-specific methodology, the provider's own documentation is the authority on how it is calculated.
Practical checklist
- [ ] What exact question is the indicator answering?
- [ ] What data series, session and adjustments are used?
- [ ] What parameters and smoothing rules are fixed?
- [ ] Is the indicator bounded, unbounded or price-denominated?
- [ ] Does a second indicator add independent information?
- [ ] What market regime is present?
- [ ] What would invalidate the interpretation?
- [ ] Have slippage, costs and execution constraints been considered?
- [ ] Has the calculation been independently reproduced?
Frequently asked questions
Is On-Balance Volume a buy or sell signal?
No. It is an analytical measure. A trade still needs a hypothesis, trigger, invalidation rule, position size, exit logic and realistic execution assumptions.
What is the best setting for On-Balance Volume?
There is no universal best setting. Start with the conventional reference (Cumulative; no universal lookback) and test nearby values across instruments, regimes and out-of-sample periods. Favor stable parameter regions over one historical winner.
Can On-Balance Volume be used by itself?
It can describe its specific market property by itself, but using it alone generally leaves other important dimensions:direction, regime, participation, valuation, liquidity or risk:undefined.
Does On-Balance Volume work on every timeframe?
The calculation may be portable, but behavior is not. A 14-period reading on a five-minute chart describes a very different market window from the same setting on a daily chart. Validate the exact timeframe.
Why does On-Balance Volume give false signals?
False signals arise from lag, noise, regime changes, parameter sensitivity, data conventions and the fact that market participants react to new information after the reading is calculated.
How should On-Balance Volume be backtested?
Write rules before testing, use point-in-time data, include delisted securities where relevant, model realistic fills and costs, reserve a validation sample, break results out by regime and compare with a simpler baseline.
Choose your next step
Apply
- On-Balance Volume Explained: OBV Trends, Divergence, and Breakout Confirmation
Step-by-step use, worked examples and the mistakes to avoid
Related Swoopr content
- Parent hub: Volume Indicators
- Related guide: On-Balance Volume Explained: OBV Trends, Divergence, and Breakout Confirmation
- Related indicators: Accumulation/Distribution Line, Anchored VWAP, Chaikin Money Flow, Cumulative Volume Delta, Money Flow Index, Relative Volume
Sources and further reading
Editorial and risk note
This page is educational content, not individualized investment advice. It does not imply guaranteed prediction, accuracy or outperformance.
Frequently Asked Questions
Is On-Balance Volume a buy or sell signal?
No. A rising OBV means volume on up closes has exceeded volume on down closes since the start. The entire period's volume is assigned by the close-to-close direction alone, so a one-cent rise counts the same as a large rally. A trade built on it still needs a trigger, an invalidation rule, a position size and realistic execution assumptions.
What is the best setting for On-Balance Volume?
On-Balance Volume takes these inputs: close of each period; volume of each period; a starting value (any base, often zero). There is no universal best setting for the tunable ones, so test them across instruments, regimes and out-of-sample periods and favor stable parameter regions over one historical winner.
Can On-Balance Volume be used by itself?
The entire period's volume is assigned by the close-to-close direction alone, so a one-cent rise counts the same as a large rally. It cannot identify who traded or why, and the level depends on where the series starts. For that reason it is read next to measures of direction, participation, valuation, liquidity and risk, not alone.
Does On-Balance Volume work on every timeframe?
The calculation (OBV(t) = OBV(t-1) + Volume if Close(t) is above Close(t-1); OBV(t-1) - Volume if below; OBV(t-1) if equal) can be run on any bar size, but behavior is not portable: a reading on a five-minute chart describes a very different market window from the same reading on a daily chart. Validate the exact timeframe before relying on it.
Why does On-Balance Volume give false signals?
A close that is up by a tiny amount adds the full volume of that bar, so the line can swing sharply on small price changes. A different start date gives a different level, and a later start drops earlier bars, which changes the prior highs and lows a divergence is compared against. Lag, noise and regime changes add to this, because market participants react to new information after the reading is calculated.
How should On-Balance Volume be backtested?
Rebuild On-Balance Volume from close of each period using point-in-time data, write the rules before testing, include delisted securities where relevant, model realistic fills and costs, reserve a validation sample and compare with a simpler baseline.