
Direct Answer
Keltner Channels is a volatility envelope around a moving average, most commonly an EMA with upper and lower bands offset by a multiple of ATR. A higher reading generally means wider channel distance reflects greater ATR-based volatility; price near an outer band reflects relative location; a lower reading generally means narrower distance reflects quieter volatility. The main limitation is that there are historical and modern formula variants, so the exact centerline and range calculation must be stated.
Keltner Channels: Formula, Meaning, Signals, Examples and How to Use It
How Is Keltner Channels Calculated?
Keltner Channels are a volatility envelope with an exponential moving average as the middle line and upper and lower lines set a multiple of the average true range away. Because ATR drives the offset, the channel width follows the typical bar range.
Formula: Middle = EMA(n); Upper = Middle + k * ATR(m); Lower = Middle - k * ATR(m)
Inputs:
- Closing prices for the EMA
- High, low and prior close for the ATR
- EMA length n (20 periods is a common modern setting)
- ATR multiplier k (2 is common) and ATR period m, which varies by platform
Worked example. With a 20-period EMA of 50, an ATR of 1.5 and a multiplier of 2, the upper channel line is 53.00. The inputs are illustrative numbers, not market data.
Reading it. Price near or beyond an outer line shows where it sits relative to a volatility-based range around the average. Width reflects ATR, so the channel is wider when typical bar ranges are larger and narrower when they are small.
Limits. There are historical and modern versions, with different centerlines and range measures, so a chart must state which one it uses. Because the middle line is an average, the channel lags, and the lines depend on both the EMA length and the ATR settings.
Indicator snapshot
| Attribute | Value |
|---|---|
| Category | Volatility |
| Creator / origin | Chester Keltner; modern ATR implementation evolved later |
| Common settings | 20 EMA with 2 × ATR is a common modern convention |
| Primary purpose | Measure dispersion, range, implied uncertainty, or expansion/contraction in price movement. |
| Main limitation | There are historical and modern formula variants, so the exact centerline and range calculation must be stated. |
What is Keltner Channels?
Keltner Channels is a volatility envelope around a moving average, most commonly an EMA with upper and lower bands offset by a multiple of ATR. It is a transformation of market data, not an independent forecast. Its value comes from making one market property measurable and repeatable so the same rule can be compared through time or across instruments when the input convention stays fixed.
This profile is separate from any trading strategy. It explains what the measure does, how it is calculated, what its readings mean, where it fails, and what other evidence can complement it. Entry, exit, position sizing and portfolio construction belong to strategy or risk-management content.
Formula
Middle = EMA(N); Upper = Middle + k × ATR(M); Lower = Middle − k × ATR(M)
Calculation requirements
- Define the asset, timeframe, session and data source before calculation.
- State lookback, smoothing, reset and initialization rules.
- Define behavior for missing values, zero denominators and warm-up periods.
- Reproduce a worked example from raw inputs.
- Compare the result with an independent implementation before publication.
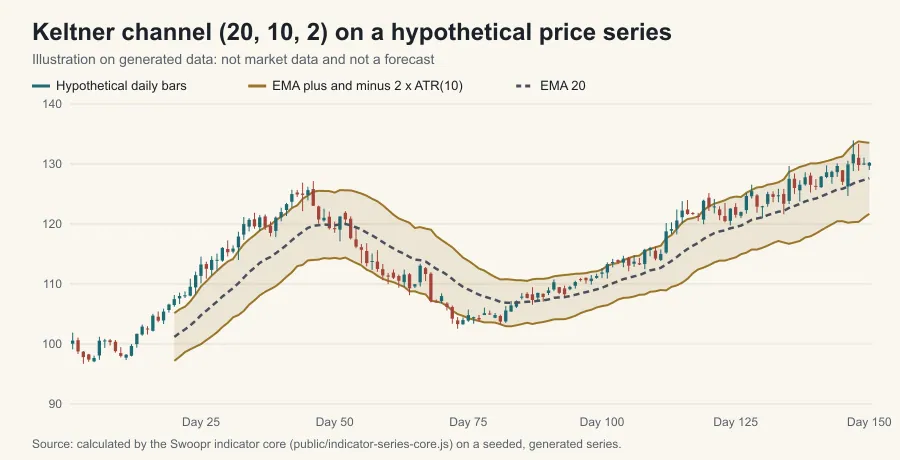
How to interpret it
A higher reading generally means wider channel distance reflects greater ATR-based volatility; price near an outer band reflects relative location. A lower reading generally means narrower distance reflects quieter volatility. That is a description of the selected inputs, not a promise about what price will do next. Strong readings can persist, reverse, or become irrelevant when the market regime changes.
The neutral zone should be defined by the indicator’s job rather than a generic red/green treatment. Direction-neutral measures should never be visually labeled bullish solely because the number is high.
Settings and parameter sensitivity
A common reference is 20 EMA with 2 × ATR is a common modern convention. Defaults are conventions, not universal optima. Shorter windows usually respond faster and create more state changes; longer windows smooth more history and react later. When multiple platform conventions exist, publish the exact one Swoopr uses and identify important alternatives.
Worked hypothetical example
Take a liquid instrument and compute Keltner Channels using the documented convention. If the reading moves materially, trace the change back to its raw inputs before assigning meaning. Then compare the reading with one independent information family such as volume, volatility, benchmark-relative performance or price structure. Finally, define what observation would invalidate the interpretation. This prevents the indicator from being treated as a standalone prediction engine.
Strengths
- Reproducible once the exact calculation is fixed.
- Suitable for screening, charting, research and comparative analysis.
- Forces the analyst to convert vague impressions into explicit rules.
- Can be evaluated against a simpler baseline and across regimes.
Weaknesses and false signals
- There are historical and modern formula variants, so the exact centerline and range calculation must be stated.
- Parameter selection can materially change signal timing.
- Platform conventions may differ even when the indicator name is the same.
- Correlated indicators can create false confidence rather than independent confirmation.
- Backtests can be overstated by look-ahead bias, survivorship bias, unrealistic fills and omitted costs.
Combining Keltner Channels with other indicators
Prefer a second measure that answers a different question. Related entities include Average True Range, Bollinger Bands, Donchian Channels, Historical Volatility, IV Percentile, IV Rank. Before calling two signals “confirmation,” test how often they disagree and whether the second measure changes out-of-sample decisions after costs.
When not to use it
Do not use Keltner Channels as a standalone buy/sell instruction or as a substitute for liquidity checks, risk sizing and execution planning. Avoid publishing optimized settings without a clearly defined universe, timeframe, cost model and validation period. Provider-defined indexes or metrics must use the provider’s disclosed methodology and licensing rules.
Practical checklist
- [ ] Exact question defined
- [ ] Data source/session fixed
- [ ] Formula and parameters documented
- [ ] Independent calculation reproduced
- [ ] Regime identified
- [ ] Redundant indicators removed
- [ ] Invalidation condition written
- [ ] Costs and execution assumptions included where relevant
Frequently asked questions
Is Keltner Channels a buy or sell signal?
No. It is an analytical measure. A decision still needs a hypothesis, trigger, invalidation rule, size and exit process.
What is the best setting?
There is no universal best setting. Start from the common convention (20 EMA with 2 × ATR is a common modern convention), test nearby values, and prefer stable parameter regions over a single historical winner.
Can it be used by itself?
It can describe its specific market property, but a complete decision usually needs additional context from another information family.
Why can the reading differ between platforms?
Data feeds, session rules, smoothing, initialization, lookback and provider methodology can all differ. Check the exact convention a given platform uses.
Does it work on every timeframe?
The formula may transfer, but behavior changes with timeframe, liquidity, volatility and execution costs. Validate the exact use case.
How should it be backtested?
Write rules before testing, use point-in-time data, include realistic costs, reserve an out-of-sample period, break results out by regime and compare with a simpler baseline.
Related Swoopr content
- Parent hub: Volatility Indicators
- Related indicators: Average True Range, Bollinger Bands, Donchian Channels, Historical Volatility, IV Percentile, IV Rank
Sources and further reading
Editorial note
Educational content only. Do not imply guaranteed prediction, accuracy or outperformance. Any provider-specific methodology must be labeled as such and rechecked when the provider changes its methodology.
Frequently Asked Questions
Is Keltner Channels a buy or sell signal?
No. Price near or beyond an outer line shows where it sits relative to a volatility-based range around the average. There are historical and modern versions, with different centerlines and range measures, so a chart must state which one it uses. A trade built on it still needs a trigger, an invalidation rule, a position size and realistic execution assumptions.
What is the best setting for Keltner Channels?
Keltner Channels takes these inputs: closing prices for the EMA; high, low and prior close for the ATR; EMA length n (20 periods is a common modern setting). There is no universal best setting for the tunable ones, so test them across instruments, regimes and out-of-sample periods and favor stable parameter regions over one historical winner.
Can Keltner Channels be used by itself?
There are historical and modern versions, with different centerlines and range measures, so a chart must state which one it uses. Because the middle line is an average, the channel lags, and the lines depend on both the EMA length and the ATR settings. For that reason it is read next to measures of direction, participation, valuation, liquidity and risk, not alone.
Does Keltner Channels work on every timeframe?
The calculation (Middle = EMA(n); Upper = Middle + k * ATR(m); Lower = Middle - k * ATR(m)) can be run on any bar size, but behavior is not portable: a reading on a five-minute chart describes a very different market window from the same reading on a daily chart. Validate the exact timeframe before relying on it.
Why does Keltner Channels give false signals?
Different platforms use different ATR periods and different centerline types, so two charts labeled Keltner Channels may not match. ATR measures range size and not direction, so the channel cannot tell a volatile advance from a volatile decline. Lag, noise and regime changes add to this, because market participants react to new information after the reading is calculated.
How should Keltner Channels be backtested?
Rebuild Keltner Channels from closing prices for the EMA using point-in-time data, write the rules before testing, include delisted securities where relevant, model realistic fills and costs, reserve a validation sample and compare with a simpler baseline.