
Direct Answer
Weighted Moving Average is a trend measure used to describe trend direction, persistence, strength, or a smoothed price reference. The production page must define the exact calculation convention before interpreting higher or lower readings, because platform and provider implementations can differ.
Weighted Moving Average: Formula, Meaning, Signals, Examples and How to Use It
How Is Weighted Moving Average Calculated?
A moving average that gives the newest price the greatest weight and decreases the weight in a straight line back through the window. The weights are the integers from 1 up to n.
Formula: WMA(n) = (1*P(t-n+1) + 2*P(t-n+2) + ... + n*P(t)) / (n*(n+1)/2)
Inputs:
- Prices
- Period n
Worked example. Prices of 10, 11 and 13 (oldest to newest) give a 3-period WMA of 11.833. The inputs are illustrative numbers, not market data.
Reading it. Because the newest price counts most, it responds faster than a simple moving average of the same length. Price above a rising WMA is read as an uptrend and below a falling WMA as a downtrend.
Limits. Faster response means more false crossovers in noisy markets, and the weights drop to zero abruptly as prices leave the window. It still lags price.
Indicator overview
| Attribute | Value |
|---|---|
| Category | Trend |
| Asset classes | Stocks, ETFs, Indexes, Futures, Forex, Crypto, Commodities |
| Output type | Line/scalar |
| Parameters | Varies by implementation; document exact settings on use |
What is Weighted Moving Average?
Weighted Moving Average is a trend measure used to describe trend direction, persistence, strength, or a smoothed price reference. The production page must define the exact calculation convention before interpreting higher or lower readings, because platform and provider implementations can differ.
For Swoopr, the canonical profile separates definition, calculation, interpretation and decision use. That keeps readers from collapsing a descriptive metric into a trading strategy. An indicator can describe trend, momentum, volatility, participation, positioning or risk without providing a complete entry, exit, sizing or portfolio decision.
What does it measure?
Weighted Moving Average measures specific market properties in the Trend domain. The practical value is repeatability: the same inputs and formula can be applied across a defined dataset, allowing users to compare readings through time or across instruments when the calculation convention is held constant.
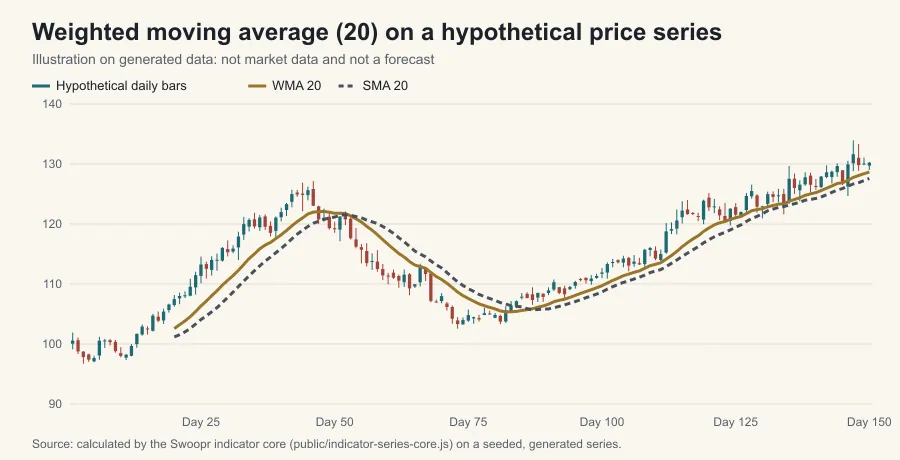
How to read Weighted Moving Average
Interpretation depends on the market property being measured. A descriptive reading is not automatically predictive. The same numerical state can lead to different outcomes in a strong trend, quiet range, event-driven gap or illiquid market. Always combine with context from price structure, volume, and broader market regime before drawing conclusions.
Strengths
- Linear integer weights give the newest bar n times the weight of the oldest, so the line responds faster than a simple average.
- The weights sum to n(n+1)/2, a closed form, so the average can be checked by direct arithmetic.
- Reproducible when the formula and data convention are fixed.
Weaknesses and limitations
- The weight profile is fixed by n, so there is no separate parameter to adjust responsiveness independent of window length.
- The newest bar carries n times the weight of the oldest, so one outlier at the end pulls the line sharply.
- Correlated indicators can create false confidence by repeating the same underlying information.
Editorial and risk note
This page is educational content, not individualized investment advice. It should not imply guaranteed prediction, accuracy or outperformance. Where multiple valid definitions exist, Swoopr states the alternatives and the reason for selecting its primary convention.
Frequently Asked Questions
Is Weighted Moving Average a buy or sell signal?
No. Because the newest price counts most, it responds faster than a simple moving average of the same length. Faster response means more false crossovers in noisy markets, and the weights drop to zero abruptly as prices leave the window. A trade built on it still needs a trigger, an invalidation rule, a position size and realistic execution assumptions.
What is the best setting for Weighted Moving Average?
Weighted Moving Average takes these inputs: prices; period n. There is no universal best setting for the tunable ones, so test them across instruments, regimes and out-of-sample periods and favor stable parameter regions over one historical winner.
Can Weighted Moving Average be used by itself?
Faster response means more false crossovers in noisy markets, and the weights drop to zero abruptly as prices leave the window. It still lags price. For that reason it is read next to measures of direction, participation, valuation, liquidity and risk, not alone.
Does Weighted Moving Average work on every timeframe?
The calculation (WMA(n) = (1*P(t-n+1) + 2*P(t-n+2) + ... + n*P(t)) / (n*(n+1)/2)) can be run on any bar size, but behavior is not portable: a reading on a five-minute chart describes a very different market window from the same reading on a daily chart. Validate the exact timeframe before relying on it.
Why does Weighted Moving Average give false signals?
The weight profile is fixed by n, so there is no separate parameter to adjust responsiveness independent of window length. The newest bar carries n times the weight of the oldest, so one outlier at the end pulls the line sharply. Lag, noise and regime changes add to this, because market participants react to new information after the reading is calculated.
How should Weighted Moving Average be backtested?
Rebuild Weighted Moving Average from prices using point-in-time data, write the rules before testing, include delisted securities where relevant, model realistic fills and costs, reserve a validation sample and compare with a simpler baseline.