
Why the Word Creates Confusion
Volatility appears in options pricing, portfolio risk reports, market commentary, and index methodology documents. In each setting it measures something different: past returns, option prices, a portfolio's aggregate behavior, or an index reading. A sentence such as "volatility is high" is not informative until you know whether it describes the current period's realized returns, what options traders are paying, how erratic a portfolio has been, or what a benchmark index is printing.
The five senses use overlapping mathematical ideas but draw on different data and answer different decision questions. Implied volatility can be high while realized volatility is low if option traders expect an upcoming event. Portfolio volatility can be low even when all holdings have high individual volatility, if their correlations are negative. Using a figure from one sense to answer a question in another produces a plausible-looking but wrong result.
Meaning 1: Realized Volatility
Realized volatility is a backward-looking statistic computed from observed returns over a completed period. The most common form is an annualized standard deviation of daily, weekly, or monthly returns over a defined lookback window such as 20 or 60 trading days. This is the sense used in risk reports, backtests, and volatility-targeting strategies.
Three parameters define realized volatility: the return frequency (daily, weekly), the lookback window (20 days, 252 days), and the annualization convention (multiplying by the square root of the number of periods per year). Two analysts using different parameter choices will produce different realized volatility numbers for the same asset over the same calendar period. A realized volatility number without all three parameters is not reproducible.
Meaning 2: Historical Volatility
Historical volatility is often used interchangeably with realized volatility, but in options analysis it sometimes refers specifically to an estimate built from a historical sample for purposes of comparison with implied volatility. The comparison is common in options screening: if historical volatility is 20 and implied volatility is 35, option traders are pricing in more uncertainty than history suggests is typical.
The distinction between realized and historical volatility matters most when the lookback window differs. A 30-day historical volatility compares differently against implied volatility than a 252-day historical volatility for the same asset. Options models often use historical volatility as an input to assess whether options appear cheap or expensive relative to recent realized moves, making the time-frame choice consequential.
Meaning 3: Implied Volatility
Implied volatility is the volatility input that makes an option pricing model consistent with the observed market price of an option. It is derived from the current option price by working the pricing model in reverse. If an option is priced at a level consistent with a 30 percent annual volatility input, implied volatility for that option is 30 percent.
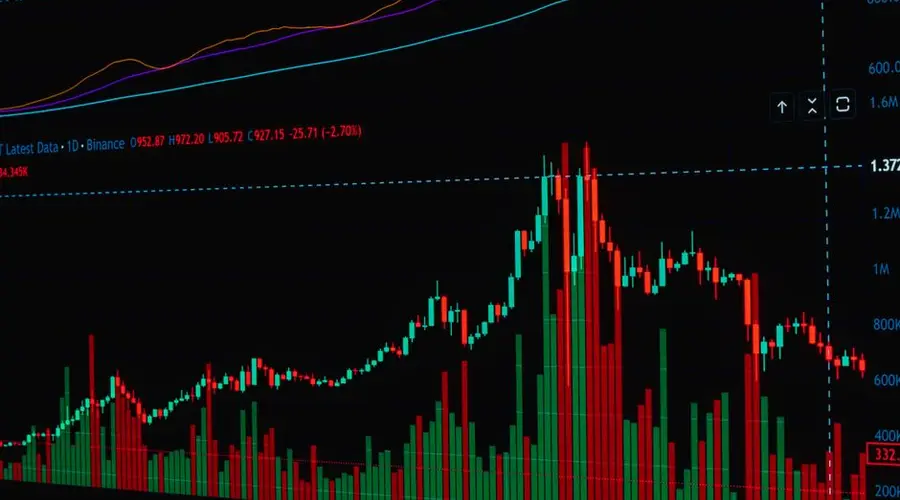
Implied volatility reflects option-market consensus about the distribution of future returns under the model's assumptions. It is not a forecast of realized volatility. Research has consistently found that implied volatility tends to exceed subsequently realized volatility over the same period, on average, which is one reason selling options has been a historically profitable strategy in certain conditions. However, implied volatility can spike sharply before events, and a single large move can produce realized volatility that exceeds even elevated implied volatility.
Meaning 4: Portfolio Volatility
Portfolio volatility is the variability of total portfolio returns, driven by individual asset volatilities, weights, and correlations. A portfolio of two assets with equal weight and equal individual volatility will have lower portfolio volatility than either asset individually if their returns are negatively correlated, and higher portfolio volatility than either asset if their returns are perfectly positively correlated.
This is the sense relevant to asset allocation, risk budgets, and portfolio optimization. A portfolio that appears diversified across sectors or geographies can still have high portfolio volatility if the assets are highly correlated during stress periods. Correlation assumptions used in normal market conditions frequently fail in crises, which is why stress-tested correlation scenarios are a standard part of portfolio volatility analysis.
Meaning 5: Volatility Index or Benchmark
A volatility index is an index produced from a defined market methodology, often options-based, that provides a single reading of expected or implied market volatility. A well-known example is a volatility index derived from S&P 500 options prices that reflects the market's expectation of 30-day volatility. Such indexes are used as market sentiment indicators, as bases for volatility products, and as hedging instruments.
A volatility index reading does not equal the realized or implied volatility of any single security. It is an aggregate measure constructed from a specific options methodology. Using a volatility index reading as a proxy for the implied volatility of a stock, a bond, or a currency produces an incorrect comparison unless the index was specifically designed for that asset class and time horizon.
Swoopr Rule
Ask whose returns, which horizon, and which estimator before comparing volatility. A volatility number without all three labels is not suitable for cross-asset or cross-period comparison.
Worked Example: Realized, Implied and Portfolio Volatility on One Day
Suppose a stock's daily returns over the last 20 trading days have a standard deviation of 1.2%. Its 20-day realized volatility (Meaning 1), annualized by the square root of 252 trading days, is 1.2% × √252 = 19.0%. If its at-the-money options are priced at an implied volatility (Meaning 3) of 28%, the market is paying for moves about half again as large as the last month produced, which is the gap an options screener would flag; nothing in either number says which direction the stock will go.
Portfolio volatility (Meaning 4) is not an average of the holdings. Put half of a portfolio in an asset with 20% volatility and half in one with 30%, with a return correlation of 0.2. The variance is 0.25 × 0.202 + 0.25 × 0.302 + 2 × 0.5 × 0.5 × 0.2 × 0.20 × 0.30 = 0.0385, so the portfolio volatility is 19.6%, below the 25% a simple average would give. At a correlation of 1.0 the figure would be exactly 25%; at a correlation of zero it would be 18.0%. All of these are hypothetical inputs chosen to show the arithmetic.
Frequently Asked Questions
What does volatility mean in investing?
Volatility is a family of measures for how widely returns or prices vary, but the word can refer to backward-looking realized volatility, a historical estimate over a chosen window, forward-looking implied volatility extracted from option prices, portfolio volatility created by multiple correlated holdings, or a volatility index built from a defined options methodology. Volatility does not say whether price will rise or fall; it says how large or uncertain moves have been or are being priced.
When does volatility mean realized volatility?
Use realized volatility when the subject is risk reports, charts, backtests and volatility targeting. In that branch, volatility refers to a backward-looking statistic computed from observed returns over a completed period. The reason the distinction matters is that the answer depends on return frequency, lookback window and annualization convention.
When does volatility mean implied volatility?
Use implied volatility when the subject is options chains, volatility surfaces and event risk. In that branch, volatility refers to the volatility input that makes an option pricing model consistent with observed option prices. The reason the distinction matters is that it reflects option-market pricing under model assumptions, not a guaranteed forecast of future realized moves.
When does volatility mean portfolio volatility?
Use portfolio volatility when the subject is asset allocation, risk budgets and portfolio optimization. In that branch, volatility refers to the variability of total portfolio returns, driven by individual asset volatilities, weights and correlations. The reason the distinction matters is that diversification can reduce portfolio volatility even when none of the holdings individually become less volatile.
What should I do when a source says only volatility?
Look for a nearby object, unit, formula, contract term or time period. Clues such as realized, historical, implied, annualized, standard deviation often resolve the intended sense. If two branches still fit, keep the answer conditional until more context is available.
Related Reading
References
Educational content only. Volatility measures vary by estimator, window, and asset class. Verify current methodology and data with the applicable primary source before acting. This page does not provide personalized investment, legal, or financial advice.