

Direct Answer
SG&A (Selling, General & Administrative expenses) is operating expenses not directly tied to producing goods or services - sales and marketing costs, executive compensation, administrative staff, office costs, and other overhead. It's reported as a line item within operating expenses on the income statement. SG&A as a percentage of revenue is commonly used to assess operating efficiency and can reveal economies of scale as a company grows.
Key Takeaways
- SG&A groups operating expenses not directly tied to producing goods or services - sales and marketing, executive compensation, administrative staff, office costs, and other overhead.
- It appears as a line item within operating expenses on the income statement, separate from cost of goods sold.
- SG&A as a percentage of revenue is commonly used to assess operating efficiency.
- That ratio can reveal economies of scale as a company grows, though the relationship can vary by business model and industry.
- Comparisons are most useful against a company's own trend over time and against similar businesses, not a universal benchmark.
What Is SG&A?
SG&A stands for Selling, General & Administrative expenses. It's a category of operating expenses that keeps the broader business running and selling its products or services, as distinct from the direct costs of producing them. The category typically bundles together several kinds of cost that share one trait: none of them go directly into making the good or delivering the service.
The "selling" piece covers sales and marketing costs - things like sales-team compensation, advertising, and promotional spending aimed at generating revenue. The "general and administrative" piece covers executive compensation, administrative staff, office costs, and other overhead - the corporate functions (finance, human resources, legal, and similar support roles) and physical or administrative infrastructure that support the business but aren't part of the production line.
SG&A is reported as a line item within operating expenses on the income statement, sitting below gross profit and typically above operating income. Because it sits within operating expenses, SG&A is one of the levers - alongside cost of goods sold and other operating costs - that separates gross profit from operating profit.
Where SG&A Sits on the Income Statement
A simplified income statement moves from revenue down to net income in stages, and SG&A's position in that sequence is what defines it. Cost of goods sold is subtracted from revenue first, to arrive at gross profit - those are the costs directly tied to producing the good or service. SG&A, as an operating expense not directly tied to production, is then subtracted from gross profit alongside any other reported operating expenses, to arrive at operating income.
| Income statement line | What it represents | Relationship to SG&A |
|---|---|---|
| Revenue | Total sales generated in the period | The base SG&A is commonly measured against, as a percentage. |
| Cost of goods sold | Costs directly tied to producing goods or services | Reported separately from SG&A - subtracted from revenue first to get gross profit. |
| Gross profit | Revenue minus cost of goods sold | SG&A is subtracted from gross profit as part of operating expenses. |
| SG&A | Selling, general & administrative operating expenses | The line item this page explains. |
| Operating income | Gross profit minus SG&A and other operating expenses | Reflects profitability after SG&A and other operating costs are deducted. |
Some companies present SG&A as one combined line; others separate "Selling" and "General & administrative" into two lines, or break out sales and marketing, or research and development, as their own distinct operating-expense lines. The exact presentation can vary by company, so confirm what a specific company's income statement actually groups into its reported SG&A figure before comparing it to another company's.
The SG&A-to-Revenue Ratio
SG&A as a percentage of revenue is calculated as:
SG&A ratio = SG&A ÷ Revenue, commonly expressed as a percentage.
This ratio is commonly used to assess operating efficiency - how much of every dollar of revenue is being absorbed by selling and administrative overhead rather than flowing toward operating profit. Because SG&A includes costs such as executive compensation and administrative staff that don't necessarily rise in lockstep with each additional dollar of sales, the ratio can reveal economies of scale as a company grows: if revenue rises faster than SG&A, the ratio falls, meaning less of each new sales dollar is being consumed by overhead. If SG&A grows faster than revenue, the ratio rises instead.

How much this relationship holds in practice can vary by company and industry. A business in a heavy customer-acquisition phase, for example, may deliberately increase sales and marketing spending as a percentage of revenue to pursue growth, which would show up as a rising SG&A ratio even though nothing about administrative efficiency has changed.
Worked Example
Hypothetical example, for education only.
A hypothetical retailer reports revenue of $400 million and SG&A of $60 million for the year. Its SG&A ratio is $60M ÷ $400M = 15%.
Two years later, after expanding its store base, the same hypothetical retailer reports revenue of $600 million and SG&A of $75 million. Its SG&A ratio is $75M ÷ $600M = 12.5%. Revenue grew 50% while SG&A grew only 25%, so the ratio fell - a pattern consistent with economies of scale, since fixed administrative and corporate overhead costs were spread across a larger revenue base.
What the example means
- SG&A did not need to grow at the same rate as revenue for the company to support more sales, which is one way economies of scale can appear in a company's cost structure.
- A falling SG&A ratio by itself doesn't confirm the underlying business improved - it should be read alongside gross margin, operating margin, and what management says is driving the change.
- This is a hypothetical illustration; actual company results, cost structures, and growth patterns vary and can move in the opposite direction.
Interpreting SG&A Trends
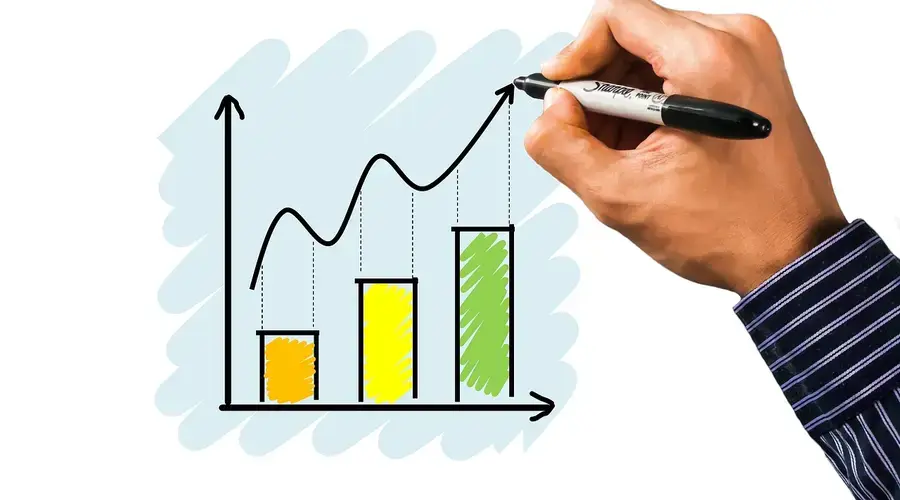
SG&A as a percentage of revenue is commonly used to assess operating efficiency, but the ratio is most informative as a trend and as a comparison, not as a single number read in isolation.
Track it over time
Comparing a company's own SG&A ratio across several periods can show whether overhead is being managed in line with revenue growth, or whether it's rising faster than sales - which can be a sign of cost discipline slipping, or of a deliberate investment phase, depending on context.
Compare within similar businesses
SG&A intensity commonly varies by business model - a company with a large direct sales force or heavy advertising spend can carry a structurally higher SG&A ratio than a company that sells primarily through automated or low-touch channels, even if both are run efficiently. Comparisons are more meaningful against similar business models than against an unrelated industry.
Read it alongside other margins
SG&A sits between gross profit and operating income, so it's one input into operating margin, not the whole story. A falling SG&A ratio paired with a falling gross margin can still produce a shrinking operating margin overall - look at the full margin picture rather than the SG&A ratio alone.
Limitations and Common Mistakes
| Mistake | Why it causes problems | Better practice |
|---|---|---|
| Comparing SG&A ratios across unrelated industries | SG&A intensity can vary widely by business model and industry, so a higher ratio doesn't automatically mean a company is less efficient. | Compare SG&A ratios within similar business models, and track each company's own trend over time. |
| Assuming SG&A is defined identically across companies | Some companies fold research and development, depreciation, or sales and marketing into SG&A; others report those as separate lines - so headline figures may not be directly comparable. | Check what's actually included in a specific company's reported SG&A line before comparing it to another company's. |
| Reading a falling ratio as automatically positive | A falling SG&A ratio can also result from cutting sales and marketing spending that was supporting future revenue growth, not just from genuine efficiency gains. | Look at revenue growth trends and management commentary alongside the ratio, not the ratio in isolation. |
| Ignoring one-time items inside SG&A | Restructuring charges, severance, or a one-time legal settlement can be embedded in a reported SG&A figure and distort the trend for a single period. | Check the notes to the financial statements for disclosed one-time items before drawing a conclusion from a single period's SG&A ratio. |
SG&A is one line item within a broader income statement, and the relationship between SG&A and economies of scale can vary by company - it is not a fixed rule that applies identically to every business. Treat the ratio as one input into a fuller review of a company's cost structure and profitability, not as a standalone verdict.
Frequently Asked Questions
What does SG&A stand for?
SG&A stands for Selling, General & Administrative expenses. It groups operating expenses not directly tied to producing goods or services, including sales and marketing costs, executive compensation, administrative staff, office costs, and other overhead.
Is SG&A the same as operating expenses?
SG&A is reported as a line item within operating expenses on the income statement, but it is not the whole category. Operating expenses can also include items reported separately, such as research and development, depreciation and amortization, or restructuring charges, depending on how a company chooses to present its income statement.
What is a good SG&A-to-revenue ratio?
There is no single good number - SG&A as a percentage of revenue varies widely by industry, business model, and company size. It is commonly used to assess operating efficiency and can reveal economies of scale as a company grows, so the more useful comparison is against the same company's own history and against similar businesses, not a universal benchmark.
Does SG&A include cost of goods sold?
No. Cost of goods sold covers expenses directly tied to producing goods or services, such as materials and direct labor, and is reported separately, above gross profit. SG&A covers operating expenses that are not directly tied to production, such as sales, marketing, administration, and overhead.
Why would SG&A as a percentage of revenue fall as a company grows?
Many administrative and overhead costs inside SG&A - such as executive compensation, corporate offices, and back-office staff - do not necessarily rise in lockstep with revenue. As revenue grows faster than those relatively fixed costs, SG&A can shrink as a share of revenue, which is one way economies of scale can show up in the income statement.
Can SG&A trends alone signal a problem with a company?
Not on their own. A rising SG&A ratio can reflect a genuine efficiency problem, but it can also reflect a deliberate growth-stage investment in sales and marketing, a one-time reorganization cost, or a change in how a company classifies expenses. Compare SG&A trends against revenue growth, margins, and management's own explanation before drawing a conclusion.
How much variation exists in what companies include in this line?
Considerable, since there is no prescribed composition and companies decide whether to include distribution costs, certain customer support functions, and research where it is not presented separately. A company folding research into this line reports a very different figure from one presenting it separately. Comparing the ratio across companies requires checking what each includes.
What drives the selling component versus the administrative component?
Selling costs generally scale with revenue and sales activity, while administrative costs are largely fixed overhead that scales with organisational complexity rather than volume. A company disclosing the split allows each to be tracked separately. Where only the combined figure is available, comparing its growth against revenue growth indicates roughly how much of it behaves as fixed.
What does a rising ratio to revenue indicate?
Either that costs are growing faster than revenue, which suggests deteriorating efficiency or investment ahead of growth, or that revenue has fallen while the fixed portion held. The two are distinguished by whether absolute spending rose. A rising ratio with flat absolute spending is a revenue problem rather than a cost problem.